article thumbnail

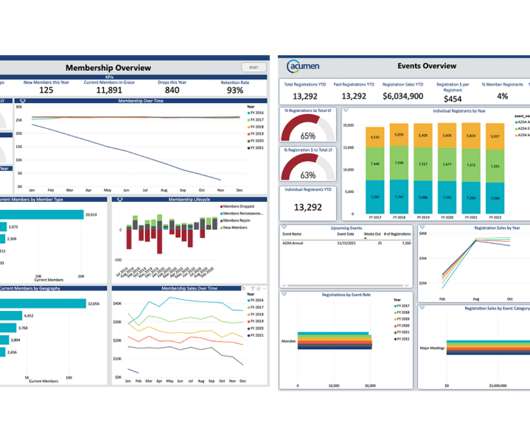
Giving Trends in Kenya: How the Growth of Mobile Payments Are Transforming Community Giving

Nonprofit Tech for Good

An Interview with Matt Roberts-Davies , General Manager of M-Changa – an official partner of the 2018 Global Trends in Giving Report. As a result, the focus has been writing grant proposals rather than appealing for individual support. Giving Trends in Kenya: 2018 Global Trends in Giving Report. ? Why is that?

Kenya 194
article thumbnail

Actionable Insights Hidden In Your Acquisition Results

Kindful

At the conclusion of every acquisition campaign , you should do a thorough review of the campaign’s results. The good news is, if you know where to look, there are actionable insights hidden in your acquisition results. It’s really important to only do an apples to apples comparison here. So where do you start?

Results 62
professionals

Sign Up for our Newsletter

This site is protected by reCAPTCHA and the Google Privacy Policy and Terms of Service apply.

article thumbnail

Blackbaud Luminate Online® Benchmark Report Highlights

sgEngage

It’s a reliable touchstone to identify giving trends as well as shifts in sustainer and email engagement in the nonprofit digital space. It’s also a valuable tool to help nonprofits evaluate their results by giving them a comparison point for their performance against organizations of similar sizes and issue areas.

article thumbnail

Pop the champagne: This year Candid’s grants data set turns 21!

Candid

This typically resulted in about 900-1,300 funders represented and 100-150k grants collected in a given year. 2013-2014 – Tweens A decade in, the importance of consistent year-over-year comparisons grew. Today, we refer to it as the “Foundation 1000”, and it is often used to look at historical grantmaking trends.

Grant 98
article thumbnail

Is Your Nonprofit Half Way to Your 2020 Fundraising Goal$?

Nonprofit Tech for Good

Let’s check out what to consider when measuring your results. For example, if you raised $5,000 as the result of a recent solicitation and spent $1,500 in mailing and printing costs to raise this money, your return on investment is $3,500 (Total Revenue: $5000- Total Expenses: $1,500 =$3,500). 3) Past Trends.

Goal 300
article thumbnail

Who is sharing nonprofit demographic data with Candid? 

Candid

i We anticipate a steady increase in organizations sharing demographic information as a result of our recently launched Demographics via Candid campaign. Here, we see a clear trend: Over 90% of nonprofits shared some demographic data about their leader. iv In comparison, the sharing rate for all other staffing levels is below 60%.

article thumbnail

Level Up Your Marketing with Analytics

Association Analytics

Having this data will help you make business decisions based on trends or actual performance. Resulting in a data-informed way to make business decisions. You can us directional attributions for: Trend comparison – compare this year’s campaign vs. previous years’ to determine which is most effective.

Analytics 169