5 Tips to Improve Sustainer Acquisition and Retention
NonProfit PRO
MARCH 21, 2024
Here are five tips to help you acquire and retain sustainers. As donor count continues to decline, it’s important to find loyal supporters.
 Tips Related Topics
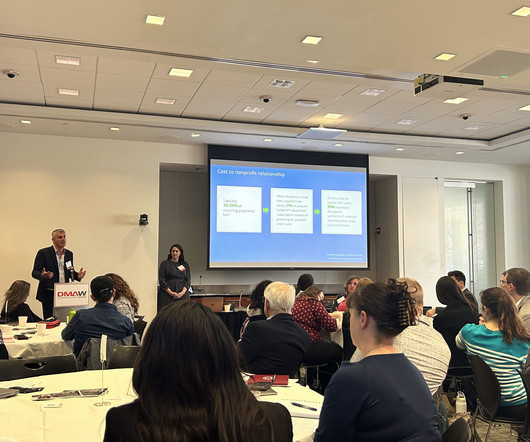
NonProfit PRO
MARCH 21, 2024
Here are five tips to help you acquire and retain sustainers. As donor count continues to decline, it’s important to find loyal supporters.

NonProfit PRO
NOVEMBER 9, 2023
Here are three tips for collecting impact data. Telling your donors that you’ve made progress toward achieving your mission is one thing, but showing how you’ve accomplished this with data does a better job of painting that picture.
This site is protected by reCAPTCHA and the Google Privacy Policy and Terms of Service apply.

NonProfit PRO
DECEMBER 14, 2023
Here are some technology tips for your nonprofit as we move into 2024. Software supports everything from fundraising to programs.

NonProfit PRO
NOVEMBER 1, 2023
Register for this Tuesday, November 14 webinar to learn tips and tricks to streamline fund tracking, data entry, reporting, and workflows for your annual budget. Spending too much time manipulating data? Relying on multiple spreadsheets to manage budgets?

NonProfit PRO
OCTOBER 27, 2023
Here’s five trends and tips for landing sponsorship dollars right now. With a decrease in individual donors, sponsorships have picked up the slack for some nonprofits.

NonProfit PRO
SEPTEMBER 15, 2023
Given the importance of public opinion and third-party ratings, we’ve compiled 10 tips to consider when establishing or maintaining your nonprofit organization’s profile. Cultivating and sustaining public trust is vital to the health of any organization.
Nonprofit Tech for Good
DECEMBER 9, 2023
Here are 10 website maintenance tips that your nonprofit can do yourself to ensure that your website is healthy and running at its best — without needing to break the bank! By CONCAT — the first website design and development company solely led by refugees and women from countries of conflict.

Expert insights. Personalized for you.


Let's personalize your content