article thumbnail

Creating a Nonprofit Digital Strategy with ChatGPT: A Practical Guide

Nonprofit Tech for Good

Explore how the strategic integration of SWOT analysis, audience mapping, SMART communication targets, channel identification, content strategy, execution and evaluation, and high-level communications planning can shape a successful digital transformation. With ChatGPT’s analytical prowess, the process can be augmented.

Digital 299
article thumbnail

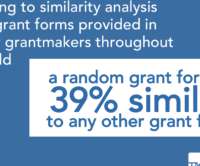
We’re 39 percent similar; how can we be exponentially better?

Candid

One such data story is this: Though long suspected, we finally have the data to confirm that 39 percent of our grant applications are duplicative across funders. Analysis of grant applications from 130 funders. Where contact information is requested, provide (if applicable) Name, Title, Address, Email Address, Phone Number.

Grant 111
professionals

Sign Up for our Newsletter

This site is protected by reCAPTCHA and the Google Privacy Policy and Terms of Service apply.

article thumbnail

New and Improved Data Visualization Tool: Maps for Media Funding

Beth's Blog: How Nonprofits Can Use Social Media

Nonprofit data nerds will love this new resource from Media Impact Funders and Foundation Center called “ Foundation Maps for Media Funding ,” a free, interactive mapping and research tool that shows the full scope of philanthropically funded media projects worldwide since 2009. Media Applications and Tools.

Map 76
article thumbnail

5 Tips for Effective Healthcare Grantmaking

sgEngage

Aggregating all of your data can help streamline your tasks and encourage analysis across multiple sources. Then map out your technology and data ecosystem so you know what you use and how it connects. Do you know how long it takes your grantees to complete your application process? Augment your reporting with data analysis.

article thumbnail

Blackbaud Discontinued Crystal Reports – Now What?

Cloud 4 Good

Blackbaud recently announced the end of support of a few applications hosted in their Citrix environments, including Crystal Reports (CT). It is available inside your CRM as shown in the image above of Tableau CRM or as a standalone application that allows you to bring data from multiple data sources as shown in the example below. .

article thumbnail

Data and Maps: Making Place Legible

NTEN

Data is vital for powerful analysis, but at the end of the day, we're swimming in it. More specifically, what about mapped data? Creating display maps – in print or as digital images – is easier than ever before, and interactive, web-based mapping is all over the place, so to speak. It's not the input, it's the output.

Map 80
article thumbnail

10 Important Features of Tableau

fusionSpan

Tableau is the most extensively used data visualization application. Availability of Maps. The map is yet another key aspect of Tableau. Tableau comes with a lot of pre-installed map data, including cities, postal codes, administrative borders, and so on. Trend Lines & Predictive Analysis. The Ask Data Tool.

Chart 52