Remove Impact Remove Rate Remove Stats Remove Support
article thumbnail

Giving Tuesday 2024: Predictions, Stats & Facts

Whole Whale

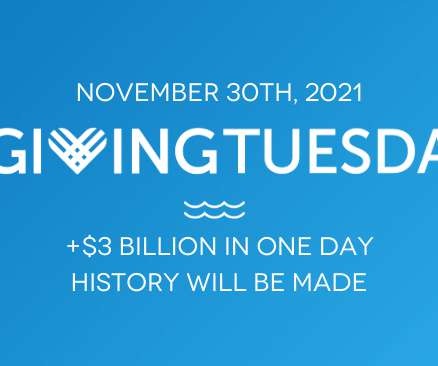
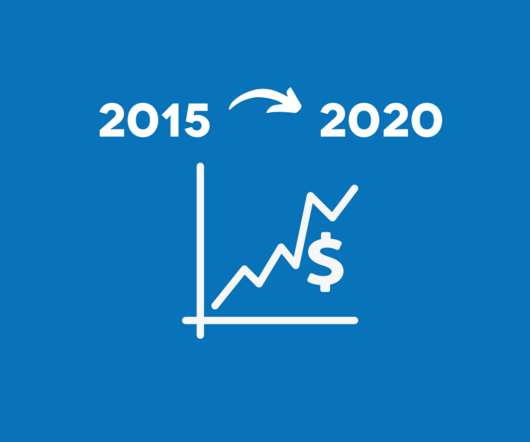
Google Trends of search for past 5 years of “GivingTuesday” This year is less predictable due to a number of factors that we see impacting this macro-giving. Historic Giving Tuesday Stats Year Whole Whale prediction Actual donation amount % Increase Total Participants 2024 $3.5 billion, a modest increase of 0.6% Billion $3.1

Stats 52
article thumbnail

Giving Tuesday 2021: Predictions, Stats & Facts

Whole Whale

This year is less predictable due to a number of factors that we see impacting this day-of-giving. One of the most striking things to note when it comes to charitable giving on the Tuesday after Thanksgiving is that overall giving in the US has been anchored to GDP at the rate of 2%. Giving Tuesday 2020 stats. Enroll Now.

Stats 122
professionals

Sign Up for our Newsletter

This site is protected by reCAPTCHA and the Google Privacy Policy and Terms of Service apply.

article thumbnail

20 Insightful Nonprofit Technology And Social Media Stats

TechImpact

Some of the most current and meaningful stats about nonprofits and the digital realm, from sources such as Nonprofit Tech For Good , Waggener Edstrom , TechSoup , and the Artez Interactive. 67% of people surveyed “like” a nonprofit on Facebook because they want to show their friends that they support a cause. response rate.

Stats 267
article thumbnail

[DATA] 11 Must-Know Stats About How Nonprofits Use Email for Digital Marketing and Fundraising

Nonprofit Tech for Good

By not using an email marketing service, your organization can not track open and engagement rates, segment your subscribers, or ensure that the opt-in is consensual. If they can not, then those subscribers should be deleted to improve your open rate, thus email deliverability. 2) 37% regularly delete unengaged email subscribers.

email 333
article thumbnail

5 Stats That’ll Change Your View Of Content Marketing Forever

TechImpact

According to a recent study conducted by Blackbaud , only 25% of nonprofits have a defined content marketing strategy, and only 26% of respondents would rate themselves as conducting an effective content marketing strategy. What’s more, is that according to the graph below, email acquisition rates have effectively quadrupled in recent years.

Stats 226
article thumbnail

5 Years of Nonprofit Fundraising Stats: [2015 to 2020] And 6 Trends to Know

Whole Whale

2015 Stats. Mail stats. Direct mail response rate (to house): 4% Postage per letter: $0.49. 2016 Stats. Mail stats. Direct mail response rate: (to house): 5% Postage per letter: $0.47. 2017 Stats. Mail stats. Direct mail response rate: (to house): 5% Postage per letter: $0.49.

Stats 96
article thumbnail

5 Google Analytics Stats To Track Fundraising Success

TechImpact

Understanding which traffic sources are generating the most donations already is key to determining where you should be focusing your efforts to bolster, and improve donation rates. The post 5 Google Analytics Stats To Track Fundraising Success appeared first on Tech Impact Blog - Leaders in Non-Profit Technology.

Stats 252