article thumbnail

Mastering The Art Of Idea Generation And Sharing

Bloomerang

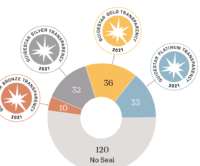
They don’t have to be fine art. Even using charts and graphs can help a lot. The post Mastering The Art Of Idea Generation And Sharing appeared first on Bloomerang. Use a lot of imagery. If you’re meeting in person, try to draw simple pictures. If you’re meeting virtually, build a collection of images you like to use.

article thumbnail

3 Infographic Tips for Nonprofits

Nonprofit Tech for Good

Simple infographics employ just a few visual elements (pictures or charts), words, and numbers. I’ve seen many infographics which are a jumble of clip art or icons labeled with numbers. In my experience, the most effective infographics have the following three characteristics: 1. Are simple. A few might work.

Tips 363
professionals

Sign Up for our Newsletter

This site is protected by reCAPTCHA and the Google Privacy Policy and Terms of Service apply.

article thumbnail

Telling the story in a new way: Should arts leaders use impact evaluation?

ASU Lodestar Center

To borrow from the song: “Art is a many splendored thing.” Art is also very subjective. Again borrowing: “One man’s trash is another man’s art.” So, what is the value of art? Recently, I attended a conference on arts education. Difficult to objectify and quantify. Math doesn’t have to be justified.

article thumbnail

The Art of Facilitating Meetings with Sticky Notes

Beth's Blog: How Nonprofits Can Use Social Media

Mine includes markers , sticky notes , index cards, and flip chart paper. Post-It Note Facilitation of A Network Map - 2012 Pakistan NGOs. What’s in your facilitation toolkit? But wait, paper??? And, I’m not alone.

article thumbnail

Reflections from Arts Leaders Workshop: Resilient Leaders from the Inside/Out

Beth's Blog: How Nonprofits Can Use Social Media

Earlier this month I was in Boston for the annual convention for Americans for the Arts where I facilitated a leadership development pre-conference workshop, “Impact without Burnout: Resilient Arts Leaders from the Inside/Out.” The five different styles included: Educator, Creator, Visionary, Organizer, and Creator.

article thumbnail

No Sweat DIY Infographics

Beth's Blog: How Nonprofits Can Use Social Media

Microsoft PowerPoint or Publisher: Both of these old standards have layout tools that make it easy to compose your infographic (and export the final product as a graphic image). I like the Smart Art templates to help me see patterns in my data. Hubspot just published this awesome collection of infographic templates for Powerpoint.

Chart 130
article thumbnail

“Seeding by ceding”: What we know about the latest group of organizations funded by MacKenzie Scott

Candid

These included higher education institutions with students from underserved communities, arts organizations, and social sector infrastructure organizations. Therefore, each chart contains information about how many grantees are represented. [ii] Editor’s note: Scott awarded a grant to Candid.) .