article thumbnail

Nonprofit Org Charts: What are They and Why are They Vital?

Donorbox

A nonprofit org chart is essential when starting a nonprofit. Determining the type of org chart will depend on the size of your organization, the work you do, and what sort of culture you […]. The post Nonprofit Org Charts: What are They and Why are They Vital? appeared first on Nonprofit Blog.

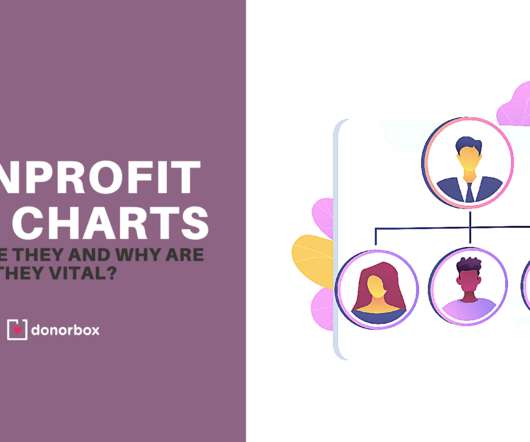
Chart 52
article thumbnail

The Ultimate Grassroots Flow Chart

Care2

Check out this great chart that Ben Murane of judaismwithoutborders. org created to help his colleagues understand the trajectory of an online acquisition into a constituent relationship management system. But if you don't analyze the data, then you are missing out on getting to know and engage with your constituents on their terms.

Chart 68
professionals

Sign Up for our Newsletter

This site is protected by reCAPTCHA and the Google Privacy Policy and Terms of Service apply.

article thumbnail

2011 NTC Preview: 6 Steps to Refocus Your Small Org Tech Strategy

NTEN

Small orgs work quickly, but often times that acceleration lacks direction. This chart is only a sample, and is not complete.) Categorize that core Tech Now add one more column to your chart: commodity or value. Leverage the SMALL ORG ADVANTAGE by looking for donated or discounted licenses.

Org 84
article thumbnail

10 Donation Page Best Practices for Nonprofits

Nonprofit Tech for Good

org has a $35 default donation amount with a $10 option as the lowest amount. For example, Children International : Also, provided your program vs. operating expense ratio is good ( 75%/25% ), create a simple pie chart graphic that illuminates your program and operating costs. Please give what you can.” ” In contrast, 350.org

Practice 363
article thumbnail

It's the Seating Chart, Stupid | Nonprofit Trends with Steve.

sgEngage

All Blackbaud Blogs Contact Us Blackbaud.com About Nonprofit Trends Books Research Reports Speaking It’s the Seating Chart, Stupid Posted by Steve MacLaughlin on November 18th, 2010 Where should the Internet team be on the organization chart? Focus on the seating chart. Who should own the Internet at our nonprofit?

Chart 62
article thumbnail

Salesforce Winter ’22 Release: What You Need to Know

Cloud 4 Good

Dynamic Gauge Charts in Dashboards (Beta). The dynamic gauge chart is now available to use report metrics and field values to respond dynamically to the displayed business metrics. For example, the gauge chart can display a subtotal of a subsidiary (i.e., For example, the gauge chart can display a subtotal of a subsidiary (i.e.,

Chart 101
article thumbnail

A quick look at Salesforce Winter ‘10

Judi Sohn

It’s almost silly that we just got the ability to show percentages in pie charts on the last release, and now we finally have combination charts. Now that “feature&# can be turned on and off for each chart. There are many other charting enhancements, but these are the ones that stood out the most to me.

Chart 113