article thumbnail

Feel the Heat: Great Tools for Mapping Website Interactions

Byte Technology

Have you ever wondered if there was a way to gauge and chart your user’s behaviors while they’re on your WordPress website? Essentially, the tools and programs for creating a heat-map build an “overlay” of your various site’s pages, and areas that attract more activity appear “hotter” than sections that experience low activity.

Map 100
article thumbnail

Beyond the Pie Chart: Maps

Tech Soup

Charts and graphs are useful, but when you have any kind of location data — whether it's postal codes, state abbreviations, country names, or your own custom geocoding — you've got to see your data on a map. You wouldn't leave home to find a new restaurant without a map (or a GPS anyway), would you?

Chart 36
professionals

Sign Up for our Newsletter

This site is protected by reCAPTCHA and the Google Privacy Policy and Terms of Service apply.
article thumbnail

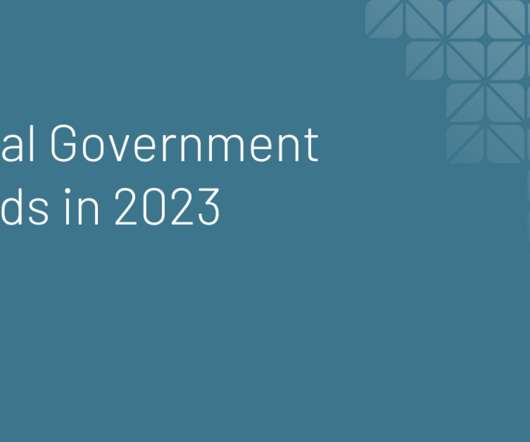
Explore funding for U.S. democracy with our free data tool

Candid

Democracy website is a great resource to help you get started. The website is a publicly available, interactive resource that showcases how funding flows for U.S. We have created three short video tours of the website, so that you can get the information you need to support your work. That’s where Candid can help.

Fund 98
article thumbnail

Five myths and misconceptions about Candid’s grant data

Candid

Candid staff also scan websites, press releases, social media, and news sources for grantmaking information. For example, we correct errors in addresses, add geographic coding, and map pieces of information into a standardized format. The chart below shows how the percentage of our data sources shift as more 990 data comes in.

Grant 111
article thumbnail

A Helpful (Unofficial) Digital Training Guide for New AmeriCorps Members

Whole Whale

So here is a 7 step road map to get started: Find and study the data Google Analytics for web traffic Email database CRM Donor database Other program/services data Course: Understanding Google Analytics. Steal this chart and use it to frame where your digital work/investments are going. Are intake webforms working?

article thumbnail

Nonprofit Finance Leaders: Don’t Miss These bbcon 2023 Sessions

sgEngage

From Chart Organizers to Dashboards, you’ll leave with practical ways you can automate and simplify your fund accounting. Improving Business Process with Process Maps : Is it really an improvement if you can’t measure the impact? They need information that helps them make data-driven decisions.

article thumbnail

RESULTS: An Acronym For Nonprofit Success

Bloomerang

Evaluate your initiatives regularly, set up feedback boxes on your website, and create regular nonprofit focus groups. Think of it like mapping a route to take. It will give you access to new voices while also keeping that flow of useful ideas coming your way. E valuate initiatives regularly.

Results 109