article thumbnail

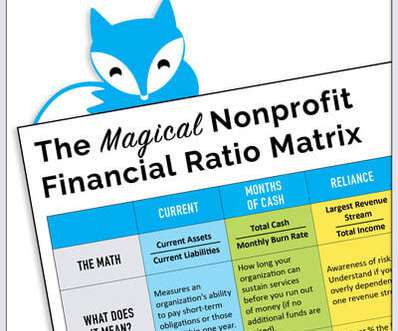
The Magical Nonprofit Financial Ratio Matrix

Blue Fox

Our team at Blue Fox created this Magical Ratio Matrix to help your organization measure its financial health against industry standards. What are the red flags for each ratio? Before you start your calculations, make sure your financial data is current. Check each box to ensure your data is squeaky clean.

Ratio 78
article thumbnail

The Importance of Data Analytics for Fundraising Events

Achieve

When hosting a fundraising event, such as a Math-A-Thon , silent auction , or charity gala, closely tracking data and adapting your event based on that data can drive higher engagement, participation, and donations. The average nonprofit email open rate is around 25%. The average nonprofit email click-through rate is about 3%.

professionals

Sign Up for our Newsletter

This site is protected by reCAPTCHA and the Google Privacy Policy and Terms of Service apply.

article thumbnail

How to Demonstrate ROI to Your Nonprofit Board Members

Nonprofit Tech for Good

Proving to your nonprofit’s stakeholders that your organization is “worthy” of their financial support is an ongoing responsibility for nonprofit management. . If your nonprofit doesn’t do this kind of record-keeping and analysis, the good news is that it is never too late to start! How to Best Illustrate ROI.

ROI 336
article thumbnail

4 Financial Metrics to Increase Transparency for Your Nonprofit

sgEngage

As leaders in the nonprofit and social impact space, it’s so important for you to project a clear sense of trust into the world. More specifically, nonprofits that went from not transparent at all to fully transparent via their Guidestar profile raised 53% more in contributions in the following year.

Metrics 98
article thumbnail

10 Donation Page Best Practices for Nonprofits

Nonprofit Tech for Good

This is the third post in a year-long blog and webinar series called 101 Best Practices for Nonprofits , written and presented by Heather Mansfield. Please sign up for Nonprofit Tech for Good’s email newsletter to be alerted of new posts. of a nonprofit’s total revenue – and those numbers will continue to grow.

Practice 363
article thumbnail

A Closer Look at Nonprofit Technology Benchmarks: Staffing Ratios

NTEN

[This is part two of a series taking a closer look at the key benchmarks from our 6th Annual Nonprofit Technology Staffing & Investments Survey Report , conducted with The NonProfit Times. Another benchmark we think is importmant for nonprofits to consider is the ratio of organizational staff to their tech-responsible staff.

Ratio 67
article thumbnail

What Are Key Event Metrics and Why Do They Matter?

Greater Giving

But getting high-quality event analytics requires high-quality, accurate numbers—which means carefully tracking data along the way. Getting clean, accurate data makes for clean, accurate KPIs, and setting yourself up for future success! So what are those metrics, and what data do you need to track to analyze them?

Metrics 98