article thumbnail

Feel the Heat: Great Tools for Mapping Website Interactions

Byte Technology

Have you ever wondered if there was a way to gauge and chart your user’s behaviors while they’re on your WordPress website? Essentially, the tools and programs for creating a heat-map build an “overlay” of your various site’s pages, and areas that attract more activity appear “hotter” than sections that experience low activity.

Map 100
article thumbnail

Information: The Better Half of IT

sgEngage

As a Database Administrator, my world revolves around helping users make sense of the information they receive, from voice-of-the-customer anecdotes and impressions to polished Key Performance Indicator (KPI) graphs, charts, and dashboards. Data gives us context. How do I care for my data? That’s okay! Data Can Sustain and Support.

Chart 78
professionals

Sign Up for our Newsletter

This site is protected by reCAPTCHA and the Google Privacy Policy and Terms of Service apply.

article thumbnail

New and Improved Data Visualization Tool: Maps for Media Funding

Beth's Blog: How Nonprofits Can Use Social Media

Nonprofit data nerds will love this new resource from Media Impact Funders and Foundation Center called “ Foundation Maps for Media Funding ,” a free, interactive mapping and research tool that shows the full scope of philanthropically funded media projects worldwide since 2009. Media Access and Policy.

Map 76
article thumbnail

5 Tips for Community Health Centers to Transition to New Fund Accounting Software

sgEngage

It will help you envision the ease of an optimized structure for your chart of accounts and the business rules that will be most beneficial. This enables the vendor to account for everything and map your history to a new and optimized chart of accounts.

Fund 90
article thumbnail

Explore funding for U.S. democracy with our free data tool

Candid

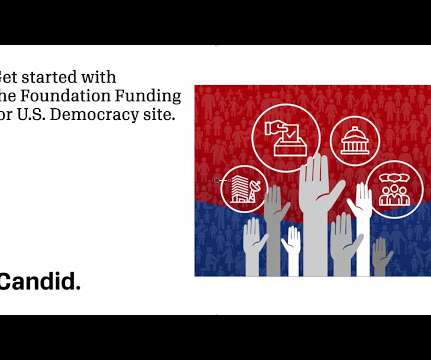
You may be curious about which nonprofits are working on what initiatives, like voting access or rights, and who the funders are that support this work, along with civic participation, media access, or other democracy-related activities in the U.S. That’s where Candid can help. Our Foundation Funding for U.S.

Fund 98
article thumbnail

Data as Decision in Grantmaking

sgEngage

When equity is prioritized, the question of data is extended to include what data can help us to notice barriers and opportunities of greater access and inclusion. Visualizing Where Meaning Making Can Happen “Mapping” activities are often the starting point of identifying data collection opportunities.

Data 99
article thumbnail

10 Important Features of Tableau

fusionSpan

The quality and accuracy of the datasets you’re working with increase when you present them in attractive graphs, charts, shapes, and plots. For data connections and user access, it features a fail-safe security system based on authentication and authorization mechanisms. Availability of Maps. Provides Great Security.

Chart 52