Remove Analytics Remove Chart Remove Measure Remove Report
article thumbnail

Blackbaud Discontinued Crystal Reports – Now What?

Cloud 4 Good

Blackbaud recently announced the end of support of a few applications hosted in their Citrix environments, including Crystal Reports (CT). While there are standard reports built in Raiser’s Edge, if you need to create custom and specialized reports, you would have previously had to use Crystal Reports for Blackbaud.

article thumbnail

Top 2021 Fundraising Strategies: Mastering an Analytical Approach to Strategy and Planning

Bloomerang

Mastering an analytic approach to strategy and planning. Master an analytic approach to strategy and planning. That’s why you need an analytic, numbers-based perspective to strategy and planning. If you have no idea what a good or poor donor retention rate is, it’s difficult to measure your own performance.

Analytics 122
professionals

Sign Up for our Newsletter

This site is protected by reCAPTCHA and the Google Privacy Policy and Terms of Service apply.

article thumbnail

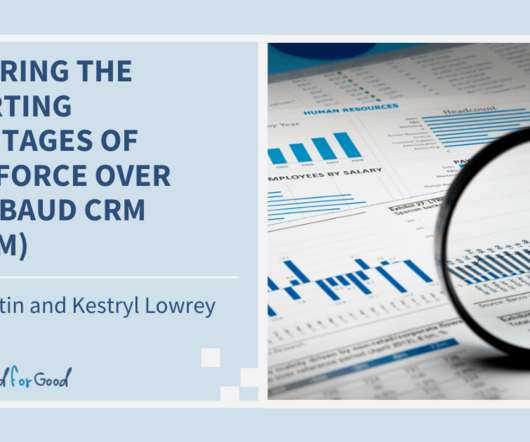
Exploring the Reporting Advantages of Salesforce Over Blackbaud CRM (BBCRM)

Cloud 4 Good

Enhanced Configurability + Analytics. One of the major differences between Salesforce and BBCRM is the capability and intuitive interface of native reporting. Combined with the ability to use Business Intelligence (BI) platforms through advanced integration capabilities, Salesforce is truly unparalleled in its analytics capabilities.

article thumbnail

How to Prepare Donor Data Reports for Your Board Members

Bloomerang

As a fundraising coordinator who prepares these reports, you work with this data every day. The last thing you want to do is waste their time and bog their donor reports down with unnecessary metrics. . Donor data to exclude from your report. Information to include in your donor report. Additional information to share.

Report 121
article thumbnail

How Do I Say It With Charts?

Beth's Blog: How Nonprofits Can Use Social Media

Source: Juice Lab Chart Chooser. Last month, Stephanie Evergreen wrote an awesome guest post called “ Six Steps to Great Charts ” with lots of practical tips for using the Excel chart feature to visualize your social media measurement data. The six steps: Step 1: Which Chart is Best? Step 6: Annotate.

Chart 105
article thumbnail

Taking Action: Fundraising Trends And Best Practices From Bloomerang’s ‘Fundraising Planning and Climate Report’

Bloomerang

This post describes actions you can take to implement the findings of Bloomerang’s 2023 Fundraising Planning and Climate Report. General guidance for fundraisers Here is general guidance on actions fundraisers can take based on fundraising trends and best practices drawn from the report.

Action 73
article thumbnail

Learning Analytics: Big Data Applied to Training, Teaching, and Learning

Beth's Blog: How Nonprofits Can Use Social Media

Learning Analytics comes from a report about the impact of emerging technologies for practitioners in a field. That sounds like the title of a report that NTEN might produce that surveys the technology landscape and nonprofit usage and provides an overview of what technologies nonprofits should be looking at in the next 1-5 years.