article thumbnail

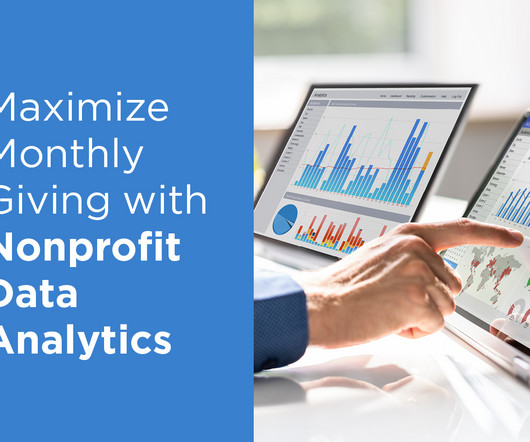
Maximize Monthly Giving with Nonprofit Data Analytics

Pamela Grow

According to the latest M+R Benchmarks Study , monthly giving increased by 11% in 2022, making up 28% of all online revenue. Analyze which types of content, stories, and communication techniques resonate most with your donors. From there, you’ll have a better idea of how donors prefer to receive communications from your nonprofit.

article thumbnail

What is Data Intelligence?

sgEngage

O ur Intelligence for Good® approach combines licensed and proprietary data assets, world-class industry data science expertise, advanced machine-learning techniques, and robust analytic methodologies – all optimized to drive your mission impact. . Examples of performance tools include performance analysis and benchmarking. .

Data 97
professionals

Sign Up for our Newsletter

This site is protected by reCAPTCHA and the Google Privacy Policy and Terms of Service apply.

article thumbnail

How are you using metrics, benchmarks, and experiments to improve your Facebook presence?

Beth's Blog: How Nonprofits Can Use Social Media

To engage and discuss techniques and tips for using Facebook effectively for nonprofits. The M&R social media benchmarks study is a good start, although the benchmarks are based on a small sample size. My Fan Page objective is: . It found that frequency of content posting doesn't no correalate with popularity.

Metrics 97
article thumbnail

Nonprofit Web Design Process Part 2a: Analytics Data as User Research

Connection Cafe

Most nonprofits already have Google Analytics installed on their website to track online traffic. For some good how-to posts, check out my co-blogger Alissa Ruehl , perhaps starting with her Intro to Google Analytics. This post is about how we incorporate Google Analytics data into our Design Process. Methodology.

article thumbnail

14 Mobile Marketing Statistics Your Nonprofit Needs To See

TechImpact

Stats say 47% of email is now opened on a mobile device Litmus –”Email Analytics” (Aug 2013). Mobile received the largest percentage of unique clicks (40%), webmail was a strong second with 35% – Experian “Quarterly Email Benchmark Study” (Q2 2013). Typically more than 25% of email is read on a smartphone, on average it is 31% for us.

article thumbnail

Intro to Google Analytics - Part 4

Connection Cafe

I’ll start off with the basics, but then we’ll get into some advanced techniques. If you’re not yet familiar with Google Analytics, it’s a free tool from. In its default state, Google Analytics tracks all activity on your website. That is difficult to block in Google Analytics.

article thumbnail

Google Analytics for Nonprofits - Part 1

Connection Cafe

This post is the first in a monthly series about Google Analytics. I’ll start off with the basics, but then we’ll get into some advanced techniques. Most clients I’ve talked to have Google Analytics installed, but aren’t always sure how to use it effectively. What is a good benchmark? It depends.