Remove Analysis Remove Benchmark Remove Channel Remove Online
article thumbnail

Check it out, mate! The 2024 M+R Benchmarks Study is here!

M+R

The latest edition of the annual M+R Benchmarks Study has arrived, and here’s your ticket to ride. Visit mrbenchmarks.com now to explore all the charts, analysis, insights, and more! Here’s a small sample of what you’ll find: Average online revenue declined by 1% in 2023, while direct mail revenue fell by 6%. Sign up now!

article thumbnail

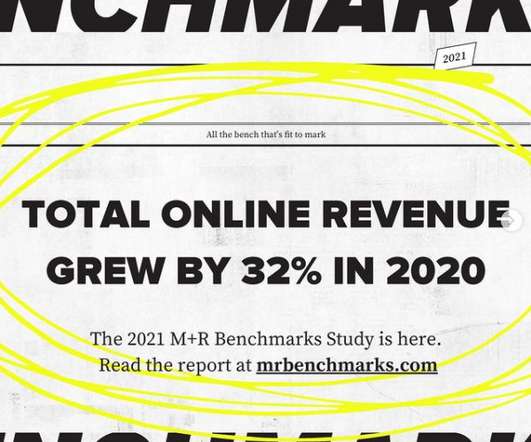
Read all about it: The 2021 M+R Benchmarks Study is here

M+R

We are excited to report that the 2021 M+R Benchmarks Study is ready for you. Go explore the findings, charts, and analysis at mrbenchmarks.com. . You will find surprises, inspiration, and a wealth of information in the full Benchmarks Study. Online revenue for nonprofits increased by 32% in 2020. 2021 Benchmarks UK FAQ.

professionals

Sign Up for our Newsletter

This site is protected by reCAPTCHA and the Google Privacy Policy and Terms of Service apply.

article thumbnail

2011 donorCentrics Internet and Multichannel Giving Benchmarking Report

NetWits

This report continues to be the most significant analysis of online/offline giving trends based on actual data from nonprofits. Key Findings: The majority of giving still comes from offline channels, but online continues to be a significant source of giving and new donors. This is a recurring theme from previous studies.

Benchmark 144
article thumbnail

Channel Surfing: A News Roundup

NetWits

Although the findings of the recently released 2011 donorCentrics Internet and Multichannel Giving Benchmarking Report haven’t changed much since the last edition three years ago, its release has (re)fueled the conversation fire in the #nptech community. But they tend to make that second donation online only about half the time.”.

Channel 118
article thumbnail

Social Media Benchmarking: Gauging Success for Project and Organizations in Global Health and Development

Beth's Blog: How Nonprofits Can Use Social Media

A benchmarking process can be as simple as finding a handful of similar nonprofit organizations and comparing your key performance metrics. Take this example comparing nonprofits performance in pinerest. Or you may use a sector wide benchmarking study such as the NTEN Social Networking Benchmarking Study. By: Rebecca Shore.

Benchmark 103
article thumbnail

Here’s Where We’ll Be: Summer 2021 Edition

M+R

June 24, 2–3:30pm ET: “2021 M+R Benchmarks: A Deep Dive” with The Nonprofit Alliance. This year’s annual M+R Benchmarks Study includes front-page news, long-form analysis, mild-mannered reporting, and even a crossword puzzle all about the newest news and topical trends affecting nonprofit digital marketing, advocacy, and fundraising. .

article thumbnail

The State of Online Fundraising

NTEN

Charities that have traditionally focused on offline fundraising have also learned in recent years the importance of online giving. In fact, the end of the calendar year is also a significant source of the funds raised online for nonprofits. The average online gift for the month of December increased to $248.82

Online 90