Remove Analysis Remove Chart Remove Data Remove Donation
article thumbnail

A crash course on trends analysis using Candid’s Foundation 1000 data set 

Candid

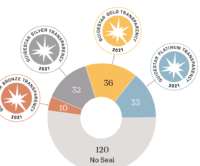
One of the most common reasons people analyze Candid’s grant data is to understand year-over-year giving trends in the sector. To do so, it’s easy to assume that the best place to start is with as much data as possible. Instead, we rely on a data set called the Foundation 1000. foundations in a given year (see chart below).

Analysis 100
article thumbnail

Integration: The Ultimate Solution for Nonprofit Data Silos

sgEngage

Many nonprofits struggle to maximize their data usage. In fact, when surveyed, 97% of nonprofit professionals expressed an interest in learning how to use their data more effectively, and only 5% reported using data in every decision they make. So, how do healthcare organizations overcome these data silos?

professionals

Sign Up for our Newsletter

This site is protected by reCAPTCHA and the Google Privacy Policy and Terms of Service apply.

article thumbnail

Mastering Next Year’s Budget With Revenue Projections and Donor Attrition Analysis

Neon CRM

Understanding Revenue Projections When a nonprofit is putting together a budget for the coming year, an important step is to perform a revenue projections analysis that can inform the expected amount of income used for operational expenses and deepen mission impact. Retention Rate: The percentage of donors who continue to donate.

article thumbnail

Check it out, mate! The 2024 M+R Benchmarks Study is here!

M+R

Visit mrbenchmarks.com now to explore all the charts, analysis, insights, and more! This year, 225 wonderful nonprofits partners joined in the fun, contributing data on fundraising, advocacy, engagement, mobilization, and marketing. You can also join us for a live webinar today, April 24, from 1:00-2:30 ET. Sign up now!

article thumbnail

“Seeding by ceding”: What we know about the latest group of organizations funded by MacKenzie Scott

Candid

Last month, philanthropist MacKenzie Scott announced that she, in partnership with her husband Dan Jewett, donated another $2.74 i Although Scott discloses who receives donations, she does not say how much is awarded to each organization, so we do not yet have information about grant size distribution in this round of giving.

article thumbnail

Beyond the Pie Chart: Maps

Tech Soup

Charts and graphs are useful, but when you have any kind of location data — whether it's postal codes, state abbreviations, country names, or your own custom geocoding — you've got to see your data on a map. So demand the same informative view from your data. Use maps to show geocoded data.

Chart 36
article thumbnail

Highest Online Donations for Nonprofits in 2016

Tech Soup

These results are based on the largest analysis of charitable giving data and come from the 2016 Charitable Giving Report. For the first time, this fifth annual edition includes insights into donor demographics, retention trends, generational giving, and significant online donations in addition to charitable giving research.