Remove Chart Remove Collaboration Remove Data Remove Map
article thumbnail

Data as Decision in Grantmaking

sgEngage

In grantmaking, one word makes more eyes glaze over than any other – data. With one shift in our understanding about data, we can reclaim a sense of wonder, creative agency, and value in our data work: Recognizing that information does not equal data and data does not equal knowledge.

Data 103
article thumbnail

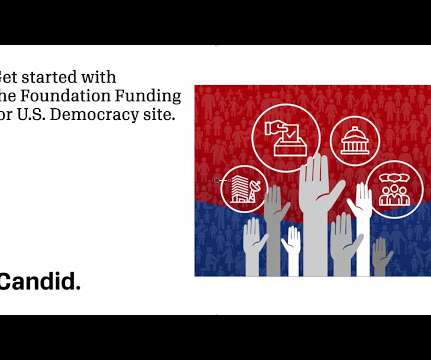
Explore funding for U.S. democracy with our free data tool

Candid

The data visualization tool, which consists of a map, charts, and lists, documents foundation support across several key areas including: campaign and election processes governing institutions and processes information and media public engagement and voting . Democracy website is a great resource to help you get started.

Fund 98
professionals

Sign Up for our Newsletter

This site is protected by reCAPTCHA and the Google Privacy Policy and Terms of Service apply.

article thumbnail

Get Your Small Business on the Map: 5 Digital Marketing Tips

Nonprofits Source

Whether you own a pet-care business , bookstore, or flower shop, these five tips will help put your small business on the digital map. Start by digging into your customer data to better understand who they are. Fostering a culture of collaboration. Fortunately, getting started doesn’t have to be complicated.

Map 52
article thumbnail

10 Important Features of Tableau

fusionSpan

Businesses deal with a lot of data, and analyzing it in its raw form is frequently difficult. The quality and accuracy of the datasets you’re working with increase when you present them in attractive graphs, charts, shapes, and plots. Tableau is the most extensively used data visualization application.

Chart 52
article thumbnail

Upcoming Webinar March 29: Mapping Philanthropy - Data Visualization for Good

Tech Soup

Here at TechSoup, we are collaborating with the Foundation Center on upcoming webinars designed to provide you with new ideas and tools to aid your organization. The first of these free webinars, Mapping Philanthropy: How You Can Use Data Visualization to Do Good , will be held on Thursday, March 29 at 11 a.m.

Map 50
article thumbnail

Nonprofit-Centric Data Sharing Sites

NTEN

Read the complete issue on "Collaboration" when you subscribe to the journal for free! Data sharing has become a critical part of collaboration and will continue to do so as we are able to access and create more data. There are many sites that allow you to upload data, as well as download other data, for free.

Site 76
article thumbnail

Webinar Recap: Mapping Philanthropy - Use Data Visualization to Do Good

Tech Soup

As you may know, we are collaborating with the Foundation Center on webinars designed to provide you with new ideas and tools to aid your organization's mission. The first webinar in this series, Mapping Philanthropy: How You Can Use Data Visualization to Do Good , was held on March 29. Data Visualization Goals.

Map 47