Remove Benchmark Remove Mail Remove Report Remove Stats
article thumbnail

82 Fundraising and Social Media Stats for Nonprofits

Nonprofit Tech for Good

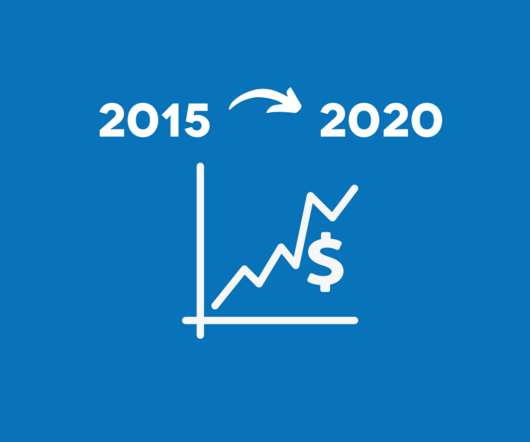
Fundraising Stats. USD ( Blackbaud Luminate Online Report ). of overall fundraising in 2018 came from online giving ( Charitable Giving Report ). 11% via direct mail/post. 1% via text message ( Global Trends in Giving Report ). USD ( Blackbaud Luminate Online Report ). 11% via direct mail/post.

Stats 279
article thumbnail

‘The Nonprofit Email Report’ Evaluated Thousands of Email Campaigns: Here’s What You Need to Know

NonProfit PRO

With data from nearly 1,500 nonprofits, nonprofit software provider Neon One has evaluated more than 37,000 email campaigns totaling more than 157 million individual emails for “The Nonprofit Email Report.” The new report provides a look at nonprofit email benchmarks for both large and small organizations.

professionals

Sign Up for our Newsletter

This site is protected by reCAPTCHA and the Google Privacy Policy and Terms of Service apply.

article thumbnail

[DATA] 11 Must-Know Stats About How Nonprofits Use Email for Digital Marketing and Fundraising

Nonprofit Tech for Good

Odds are your emails are going to spam folders and are in violation of email compliance laws that require opt-out information and a mailing address to be prominently featured in all email campaigns. According to the M+R Benchmarks Report , for every 1,000 fundraising emails delivered, nonprofits raised $78 (up from $45 in 2020).

email 334
article thumbnail

5 Years of Nonprofit Fundraising Stats: [2015 to 2020] And 6 Trends to Know

Whole Whale

2015 Stats. Mail stats. Direct mail response rate (to house): 4% Postage per letter: $0.49. Giving Report. 2016 Stats. Mail stats. Direct mail response rate: (to house): 5% Postage per letter: $0.47. ” – U.S. Giving Report. 2017 Stats. Mail stats.

Stats 96
article thumbnail

Nonprofit Benchmark Study Shows Nonprofits Are Raising More Money

Care2

Last month we reported that online fundraising response rates declined 27% between 2011-2012, according to the eNonprofit Benchmark study. According to the report, response rates on appeals declined by more than 18%. “This is present in direct mail, telemarketing, and face-to-face solicitation.”

article thumbnail

14 Mobile Marketing Statistics Your Nonprofit Needs To See

TechImpact

O2 – “Mobile life report” UK (2013). Stats say 47% of email is now opened on a mobile device Litmus –”Email Analytics” (Aug 2013). Mobile received the largest percentage of unique clicks (40%), webmail was a strong second with 35% – Experian “Quarterly Email Benchmark Study” (Q2 2013). Equinux (June 2013).

article thumbnail

Nonprofit Email: The Rules of Engagement

Pamela Grow

Well, I’ve got some eye-opening stats that might make you reconsider where to channel your communication efforts. When it comes to reaching your fundraising goals, email reigns supreme (after direct mail and face-to-face, of course). A PS is imperative in direct mail and you’ll want to include one in your emails as well.

email 52