Remove Benchmark Remove Donation Remove Metrics Remove Model
article thumbnail

Google Analytics and Benchmarks: HAWK

M+R

Hey data friends, it’s our favorite time of the year, the birds are singing, the flowers are blooming, you can sip your iced coffee outside and read Benchmarks ! Instead of tracking sessions , GA4 uses an event-based data model. It’s not accurate to compare UA pageview data to GA4 pageview data since the metric logic has also changed.

article thumbnail

Maximize Monthly Giving with Nonprofit Data Analytics

Pamela Grow

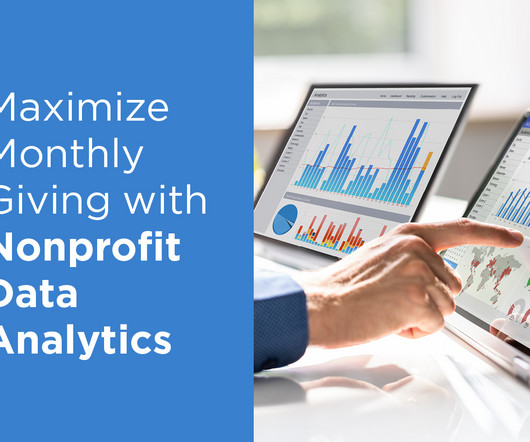
According to the latest M+R Benchmarks Study , monthly giving increased by 11% in 2022, making up 28% of all online revenue. Before you begin any project involving data analysis, start by clearly outlining your goal so you know which metrics to analyze. When laying out your goal, consider following the SMART model for goal setting.

professionals

Sign Up for our Newsletter

This site is protected by reCAPTCHA and the Google Privacy Policy and Terms of Service apply.

article thumbnail

Why 2024 May Be a “Make or Break” Year for Nonprofits

Allegiance Group

Nearly all new reports and benchmarks show a decline in both donors and dollars, and the Fundraising Effectiveness Project’s (FEP) latest Quarterly Fundraising Report is no exception. High-Level Takeaways from the FEP Report FEP tracks three key metrics: donors, dollars, and retention. Still, it’s a concerning trend.

Trend 52
article thumbnail

10 Simple Fundraising Tips Guaranteed to Improve Effectiveness

sgEngage

Individuals raising money for a cause they care about deeply want to surpass their donation goals and build enthusiasm for the mission. And nine times out of 10, P2P fundraisers end up doing better than they originally hoped, even when they set their personal donation goals high, within reason, to inspire themselves and their donors.

article thumbnail

Taking a Deeper Look at the “Social” Piece of ESG (Environmental Social Governance)

sgEngage

million was donated to support social justice campaigns in 2020. That survey established a critical baseline that we can use to benchmark our progress in the future. These will be critical metrics for us to gauge our performance. We’ll also, of course, be looking at internal metrics that will help guide our business as well.

article thumbnail

Guide to Blackbaud Fundraiser Performance Management

DNL OmniMedia

On average, we know that over 80% of a nonprofit’s total donations come from the top 12 donors to the organization. It involves examining the data and performance metrics of individual major gift officers, as well as the team as a whole, to understand what’s working and what leaves room for improvement. Peer Benchmarking.

article thumbnail

How many fundraising emails should you send a year?

Care2

If you look at the latest M+R Benchmark study , the number of donation appeals sent per year to nonprofit supporters averages about twenty-four. Furthermore, those appeals might be buried in a newsletter – not even a standalone appeal in which the only call to action is to donate. In short, more good emails = more revenue.

email 77