Remove Audience Remove Comparison Remove Measure Remove Question
article thumbnail

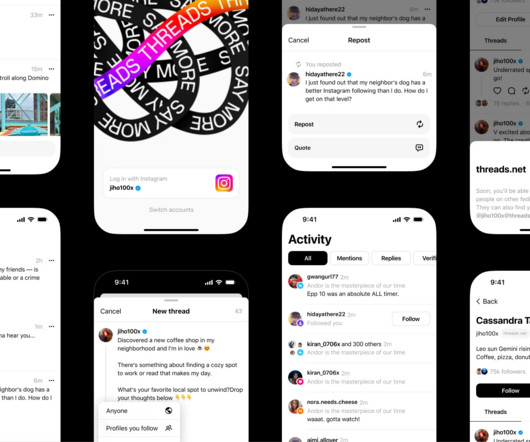
Early guidance on Threads, Meta’s answer to Twitter

M+R

Maybe you (or your audiences) are still waiting on an invitation to Bluesky. Here’s what we like about Threads: Easy, captive audience. If you have an Instagram presence, you can quickly build your Threads audience based on your IG following. Threads has a built-in audience and simple integration with Instagram.

Twitter 102
article thumbnail

Spreadsheet Aerobics: Actionable Measurement for Social Media

Beth's Blog: How Nonprofits Can Use Social Media

I have been thinking a lot about actionable social media measurement strategies that are fit and trim and light on their feet! Inspired by the Measure Everything: Is Your Nonprofit Facebook Page Worth It? , You should also be thinking about what to measure and an efficient method for collecting that data before you begin.

professionals

Sign Up for our Newsletter

This site is protected by reCAPTCHA and the Google Privacy Policy and Terms of Service apply.

article thumbnail

Measuring Your Crowdsourcing Efforts by Aliza Sherman

Beth's Blog: How Nonprofits Can Use Social Media

We’ve been chatting about how to measure the impact of the crowd and she offered to write this guest post on the topic. Measuring Your Crowdsourcing Efforts by Aliza Sherman. In order to know how to measure crowdsourcing results, you first need to understand what kind of crowdsourcing you’re implementing. Measuring Work.

Measure 104
article thumbnail

Pop the champagne: This year Candid’s grants data set turns 21!

Candid

as measured by total giving. 2013-2014 – Tweens A decade in, the importance of consistent year-over-year comparisons grew. The manual is written for a research audience and offers all the detailed ins-and-outs of Candid’s grants and transactions data—where it comes from, how it’s changed, what to consider, and how to interpret it.

Grant 77
article thumbnail

How to Prepare Donor Data Reports for Your Board Members

Bloomerang

Great question! This will provide a frame of reference for this year’s performance in comparison to the previous year, allowing your board to pinpoint key areas they should focus on going forward. This will help you measure improvement year-over-year and hold your team accountable for meeting various goals. Wrapping up.

Report 125
article thumbnail

How is GA4 Different Than Universal Analytics (UA)?

Whole Whale

All of the default Audience/Behavior/Acquisition/Attribution from UA are gone and there are very few default views in the “Reports” section in GA4 (but things change weekly). The search bar allows you to type a question about your data like: “how many users came to the site last month?” Snapshots of navigation from 5/11/2022).

article thumbnail

How Do I Say It With Charts?

Beth's Blog: How Nonprofits Can Use Social Media

Last month, Stephanie Evergreen wrote an awesome guest post called “ Six Steps to Great Charts ” with lots of practical tips for using the Excel chart feature to visualize your social media measurement data. The vertical is used to label and measure different items. Time Series Comparisons. Step 4: Directly Label.

Chart 105