Remove Benchmark Remove Stats Remove Survey Remove Trend
article thumbnail

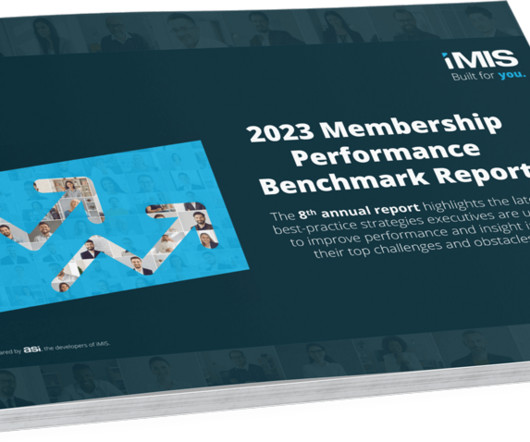
ASI Releases 2023 Membership Performance Benchmark Report

NonProfit PRO

ASI has released the results of its global 2023 Membership Performance Benchmark Survey. The eigth annual survey, conducted in late 2022, examines membership trends, including recruiting, retention, and engagement.

Benchmark 237
article thumbnail

[DATA] 11 Must-Know Stats About How Nonprofits Use Email for Digital Marketing and Fundraising

Nonprofit Tech for Good

At the core of the project is the 2021 Global NGO Technology Survey and the data below is based on the survey responses of 478 nonprofit email marketing managers. To receive future updates about the Global NGO Technology Survey data, please sign up for Nonprofit Tech for Good’s email newsletter.

email 332
professionals

Sign Up for our Newsletter

This site is protected by reCAPTCHA and the Google Privacy Policy and Terms of Service apply.

article thumbnail

10 Must-Know Stats About Online Fundraising

Nonprofit Tech for Good

Source: Benchmarks. Source: Global Trends in Giving Report. Source: Global Trends in Giving Report. Source: Global Trends in Giving Report. English, français, português y español, the 2018 Global NGO Technology Report is based on the survey results of 5,352 NGOs from 164 countries. Source: Network for Good.

Stats 227
article thumbnail

Decoding Nonprofit Research: Ensuring Authenticity Over Marketing Hype

Neon CRM

Being able to benchmark performance against what other nonprofits are doing is an important starting point to understanding your own data. Trends Reports First, let’s look at reports that focus on large scale trends impacting the entire sector. This is where the increasing amount of nonprofit sector research reports can help.

Hype 52
article thumbnail

14 Mobile Marketing Statistics Your Nonprofit Needs To See

TechImpact

ExactTarget – “The 2012 channel preference survey” (2012). Stats say 47% of email is now opened on a mobile device Litmus –”Email Analytics” (Aug 2013). Mobile received the largest percentage of unique clicks (40%), webmail was a strong second with 35% – Experian “Quarterly Email Benchmark Study” (Q2 2013). Equinux (June 2013).

article thumbnail

eNonprofit Benchmarks Study Reveals Latest Metrics for Advocacy, Fundraising and Social Media

Care2

Check out the 2010 eNonprofit Benchmarks Study from M+R Strategic Services and NTEN which surveyed 40 nonprofit organizations and analyzed all of this data and more. Key Benchmarks: How Did Your Nonprofit Measure Up ? Nonprofits need to pay special attention to this stat. Are nonprofits experimenting with mobile more?

article thumbnail

How are you using metrics, benchmarks, and experiments to improve your Facebook presence?

Beth's Blog: How Nonprofits Can Use Social Media

Measuring this requires some surveys of fans as well as counting the number of insights gleaned from posts and discussions from Fans. To refine a content strategy, I used the Fan Page insights metrics tool, particularly the stats on interactions and Fan Page growth. I have not done this yet.

Metrics 97