Remove Benchmark Remove Causes Remove Mail Remove Studies
article thumbnail

New Report: 2011 eNonprofit Benchmarks Study

NTEN

Not necessarily, according to the 2011 eNonprofit Benchmarks Study , just released at the 2011 NTC by M+R and NTEN. People unsubscribe because they read your message and decide your cause isn't interesting to them; people donate because they read your message and decide that it is. The average nonprofit in the study sent 3.6

article thumbnail

Call for Partners! The 2020 Global Trends in Giving Report

Nonprofit Tech for Good

Our partnership model is simple and innovative: in exchange for promoting the 2020 Global Trends in Giving Survey to donors and supporters of nonprofit organizations in your country from March 1 through May 31, 2020 , our partners receive the anonymized survey data for their country or cause. Benefits of Partnership.

Global 204
professionals

Sign Up for our Newsletter

This site is protected by reCAPTCHA and the Google Privacy Policy and Terms of Service apply.

article thumbnail

10 Online Fundraising Best Practices for Nonprofits

Nonprofit Tech for Good

The first “Donate Now” button was released in 1999 by a project of the Tides Foundation called Groundspring (acquired by Network for Good in 2005) and for the next two decades, nonprofit professionals have embraced the study of inspiring people to give online to good causes. 8) Embrace Cause Awareness and Giving Days.

Practice 339
article thumbnail

Announcing New Study: The 2012 Nonprofit Donor Engagement Study

NTEN

NTEN partnered with Charity Dynamics to conduct the 2012 Nonrprofit Donor Engagement Study. This donor-focused study gathered feedback from consumers spanning a wide range of giving levels ($25 – $5,000+) who donated to a nonprofit in the past 12 months. > Download the study online here.

Studies 73
article thumbnail

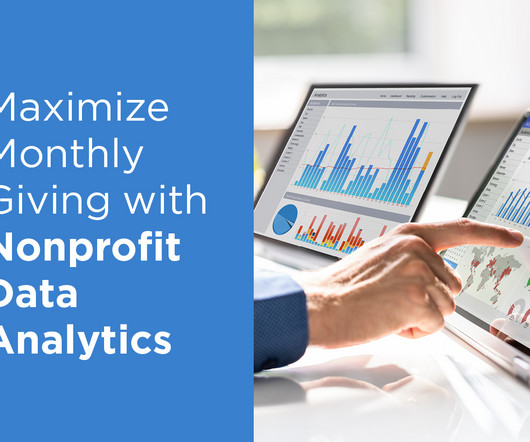
Maximize Monthly Giving with Nonprofit Data Analytics

Pamela Grow

According to the latest M+R Benchmarks Study , monthly giving increased by 11% in 2022, making up 28% of all online revenue. Your data can reveal hints about donors’ giving preferences, giving capacity, willingness to give, and the reasons why they support your cause. Understand donors’ giving behaviors. Engagement level.

article thumbnail

A Look At Canadian Philanthropy Across Generations

Care2

Last week Blackbaud along with partners HJC, Sea Change Strategies, and Edge Research released findings from the 2013 Next Generation of Canadian Giving study. The study looked at the following: What are the preferred giving channels for Generation Y (18-32); Generation X (33-48); Baby Boomers (49-67); and Civics (68+) ? Embrace it!

article thumbnail

Convio Releases Nonprofit Online Marketing Benchmarks Study - Online Fundraising, Advocacy, and Social Media - frogloop

Care2

57) Mobile (15) Nonprofit Benchmark Studies (15) Nonprofit Events (36) nptech (8) Online Advertising (5) Online Advocacy (47) Online Fundraising (97) Online Marketing (59) Online Organizing (32) SEO (3) Social Networking (109) Technology (31) Trends (51) Video (27) Volunteering (2) Web 2.0 (60) Donors hate feeling like cash machines.”

Convio 31