article thumbnail

Making the Web Accessible: Color Choices

Media Cause

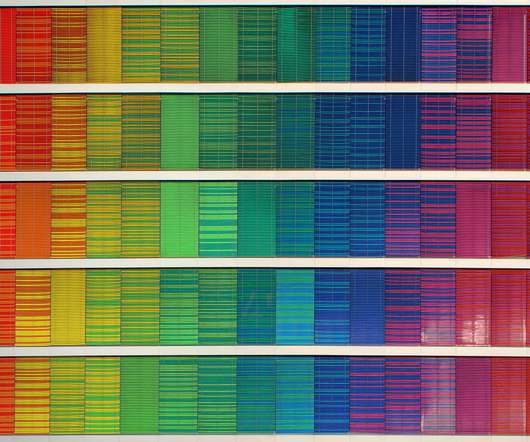
For me it’s a subtle issue with greens and reds — deuteranopia is the medical term for it. I can most easily explain it like this: if you show me a bold ketchup red, and a strong Kermit green, I can tell you what colors those are, no problem. The vague shades are usually indistinguishable to me.

article thumbnail

Markets for Good Post: Design A Better Dashboard

Beth's Blog: How Nonprofits Can Use Social Media

Dashboard design is more than simply clarifying outcomes and key metrics. Many times dashboard design is focused on “getting it done efficiently” and graphs and does not address the human side – buy-in, learning from data, and consensus on metrics. Metrics for Movements.

Design 99
professionals

Sign Up for our Newsletter

This site is protected by reCAPTCHA and the Google Privacy Policy and Terms of Service apply.

article thumbnail

Guest Post: Introducing the New GuideStar Nonprofit Profile

Beth's Blog: How Nonprofits Can Use Social Media

This means simple financial metrics will no longer be the primary focus when telling a nonprofit’s full story ( goodbye, overhead ratios !) Diversity information of nonprofits, their employees, and their boards (in partnership with D5 and Green 2.0). Increased focus on information that matters most. It’s simple.

Profile 50
article thumbnail

Using Metrics to Boost Your Fundraising

NonProfit Hub

You might answer this question with metrics like the number of new donors or the number of donations. While these basic figures can be informative from a year-over-year trend perspective, they do a poor job answering questions like: Why did these metrics change? I consider those basic metrics to be “rearview mirror” metrics.

Metrics 87
article thumbnail

ROI: What are the best "I" words for nonprofits to think about Social Media and ROI?

Beth's Blog: How Nonprofits Can Use Social Media

It is a flow chart that calculates business performance taking into account not only whether the company had a profit, but whether that profit was good enough relative to the assets it took to generate it. They are saying that you need to measure value and that it value doesn't necessarily translate into dollars.

ROI 74
article thumbnail

User Experience: What Can Frank Lloyd Wright Teach Us?

Forum One

Institute for Peace 's " Building for Peace ," where the designer has layed a yellow bar chart over the banner image instead of aligning it in the right column. Incidentally, here's a lovely set of images of several Wright homes with brilliant green foliage as a backdrop. Have any other metrics to add to this list?

Teach 44
article thumbnail

Building your Donor base on Facebook - The Nature Conservancy's experience.

Michael Stein's Non-profit Technology Blog

They did this by creating a Cause and a Fan Page for the org, and by forming a relationship with an ecology oriented game on Facebook, (lil) Green Patch. Six months later the (lil) Green Patch application is one of the most popular on Facebook, with of 6 million users! Me - How did (lil) Green Patch come about?