Remove Donor Remove Global Remove Homeless Remove United States
article thumbnail

22 Statistics About #GivingTuesday Donors Worldwide

Nonprofit Tech for Good

#GivingTuesday 2020 is December 1 and below are important data about GivingTuesday donors to help your nonprofit create a successful campaign. The data from GivingTuesday comes from their 2019 GivingTuesday Impact Report and the 2020 Global Trends in Giving Report data is based on the survey responses of 2,263 GivingTuesday 2019 donors.

article thumbnail

25 Global Trends in Giving That Nonprofits Need to Know About

Nonprofit Tech for Good

6,057 donors completed the 2018 Global Trends in Giving Survey and based on their responses, the donor community worldwide is made up of primarily women (65%) who have a liberal ideology (53%) , characterize themselves as religious (72%), and give between ($101-$1,000 USD) annually (43%). 20% say Instagram, and 13% say Twitter.

professionals

Sign Up for our Newsletter

This site is protected by reCAPTCHA and the Google Privacy Policy and Terms of Service apply.

article thumbnail

82 Fundraising and Social Media Stats for Nonprofits

Nonprofit Tech for Good

54% of donors worldwide prefer to give via credit or debit card. 1% via text message ( Global Trends in Giving Report ). The number of new donors giving to charity declined by 7.3% The number of new retained donors dropped 14.9% ( Fundraising Effectiveness Project ). The average online gift in 2018 was $96.40

Stats 279
article thumbnail

Cut Through the Clutter: Why Storytelling Matters for Nonprofits

Nonprofit Tech for Good

Donors, especially millennial donors, are motivated by specific issues and causes and typically do not have allegiance to specific organizations. This means that nonprofits have to compete with each other for donors’ attention and resources as they gravitate towards causes rather than organizations.

article thumbnail

10 Donation Page Best Practices for Nonprofits

Nonprofit Tech for Good

Sending donors a third-party payment site, such as PayPal, is problematic if that is the only way that donors can give. According to Network for Good , one in six online donors will drop out of the donation process if they are sent to a third-party website. Monthly donors give $35.46

Practice 363
article thumbnail

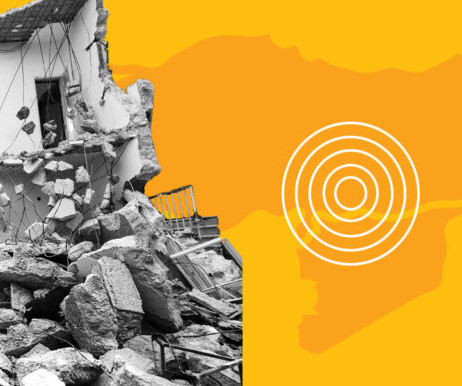
Philanthropy’s response to the Turkey and Syria earthquake 

Candid

million Turks in temporary shelters and left more than 500,000 Syrians homeless, according to the United Nations. The United Nations also issued an appeal for an additional $1 billion in aid, and the European Bank for Reconstruction and Development pledged €1.5 million from 40,000 donors. An estimated 2.2 billion ($1.6

Syria 96
article thumbnail

Giving Trends in Kenya: How the Growth of Mobile Payments Are Transforming Community Giving

Nonprofit Tech for Good

An Interview with Matt Roberts-Davies , General Manager of M-Changa – an official partner of the 2018 Global Trends in Giving Report. Another factor to consider is the limited access and high expense of processing credit cards and PayPal in Kenya compared to the United States. 39% of donors in Kenya give tribute gifts.

Kenya 194