Remove Application Remove Award Remove Comparison Remove Data
article thumbnail

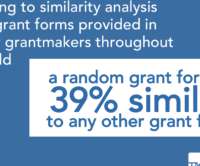
We’re 39 percent similar; how can we be exponentially better?

Candid

At times those voices were passionately personal, at others they were mandates delivered through data. One such data story is this: Though long suspected, we finally have the data to confirm that 39 percent of our grant applications are duplicative across funders. Analysis of grant applications from 130 funders.

Grant 111
article thumbnail

Gyrus Systems Earns Award For “Best Compliance LMS” By Talented Learning

Gyrus

Gyrus Systems' earned this award by developing GyrusAim features that "are admin focused and have skills, competencies, audit trails, electronic signatures, strong ILT management, facility and resource management, broad content support and powerhouse reporting."

Award 45
professionals

Sign Up for our Newsletter

This site is protected by reCAPTCHA and the Google Privacy Policy and Terms of Service apply.

article thumbnail

Foundation giving and payout: what changed in 2021?

Candid

The data gathered shows that funders are continuing to pay attention to current events, including the pandemic. . Overall giving dollars increased from FYE 2020 to 2021 by 12% among 519 survey respondents who provided funding data for both years. Comparisons of FYE 2020 and FYE 2021 giving are unadjusted for inflation.)

article thumbnail

3 Steps to Finding the Right Technology Vendor for Your Nonprofit

Everyaction

Quantify values to help compare When possible, assign number values to desires and compatibility to aid in comparison. Spreadsheets are great for this, because the ability to sort and filter data also makes visual analysis easier. For any given feature, whether or not a vendor meets your needs may not be a simple yes or no answer.

article thumbnail

Is There Any Grant Money?

Tech Soup

According to early results from GrantStation's Spring 2017 State of Grantseeking™ Report, 75 percent of those organizations that submitted just one grant application won an award. And the number of applications submitted increases the likelihood of winning awards. This can be difficult to do.

Grant 47
article thumbnail

Reporting for Grantmakers: Charts vs. Lists to Make Sense of Your Data

sgEngage

As a grantmaker in a digital world, gathering data seems to be the easy part. You have data on your grantees flowing into your grant management system (GMS) through applications and their updates. Your own historical data on grants awarded accumulates with every grant cycle. Using Lists in Your Grant Reporting.

Chart 76
article thumbnail

Get the Most Out of Engagement Scoring

Association Analytics

As data-loving professionals, our team gets many questions about what an engagement score is, how to assign members points and how to use the data. Engagement points for each section are based on comparison to the population. Use data to calculate. We suggest using three years of data for relevancy. Award nominees.

Model 169