Remove Aggregator Remove Chart Remove Data Remove Trend
article thumbnail

Chart the Future of Volunteer Management

VQ Strategies

Your valuable input is crucial to discovering the most current trends in volunteer engagement. This survey serves as a pulse check for the field of volunteerism by providing a nuanced view of challenges, trends, and opportunities. Let’s chart the course for the future together! Why Participate?

Chart 52
article thumbnail

Integration: The Ultimate Solution for Nonprofit Data Silos

sgEngage

Many nonprofits struggle to maximize their data usage. In fact, when surveyed, 97% of nonprofit professionals expressed an interest in learning how to use their data more effectively, and only 5% reported using data in every decision they make. So, how do healthcare organizations overcome these data silos?

professionals

Sign Up for our Newsletter

This site is protected by reCAPTCHA and the Google Privacy Policy and Terms of Service apply.

article thumbnail

The Better FAFSA: What Colleges Need to Know Right Now

sgEngage

It also takes federal tax information directly from the IRS and transfers it into the form, rather than asking students and families to manually enter certain data. The delays with the Better FAFSA have forced many colleges to get creative, leveraging CSS profiles in lieu of the SAR or as a backup tool until they receive FAFSA data.

Student 83
article thumbnail

Data and Storytelling: 6 Ways to Use Data to Move Your Mission

NTEN

By Kurt Voelker, CTO, Forum One Data is the new black. These days everyone is releasing it, visualizing it, aggregating it, and mashing it up. Data is so much more than a stack of numbers or a server filled with client outputs. The truth can become obvious when you reveal the change in data in a visual way.

Data 100
article thumbnail

Zoetica Salon February Theme: Practical and Tactical Social Media for Nonprofits

Beth's Blog: How Nonprofits Can Use Social Media

If you are wondering about the chart, it came a cool free tool called “ Export.ly “ It will analyze your Twitter audience, Facebook page, and even your email box by grabbing the data and dumping it into a spreadsheet. 4 Social Trends Impacting the Future of Online Fundraising. I used it analyze the Facebook page.

article thumbnail

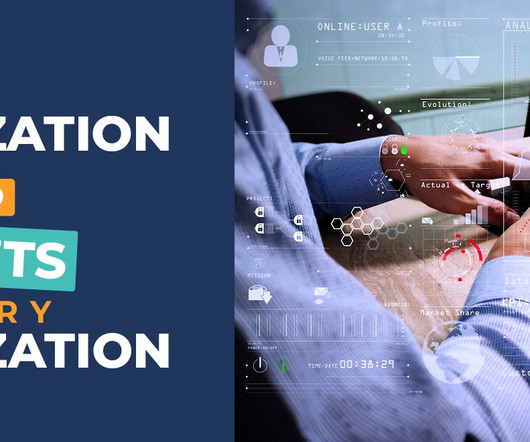
Data Visualization Do’s and Don’ts for Every Organization

DNL OmniMedia

Whether you’re analyzing patient outcomes, tracking academic trends, or gathering insights from donor demographics, data visualization can be a valuable tool for any organization. Let’s explore key data visualization do’s and don’ts to transform your communication and align your team.

Data 52
article thumbnail

Reporting for Grantmakers: Charts vs. Lists to Make Sense of Your Data

sgEngage

As a grantmaker in a digital world, gathering data seems to be the easy part. You have data on your grantees flowing into your grant management system (GMS) through applications and their updates. Newsletters with industry trends hit your inbox almost every day. Check out our full infographic on Communicating Grantmaking Data.

Chart 73