Remove Chart Remove Data Remove Fund Remove Ratio
article thumbnail

Statement of Activities: Common Mistakes and How to Avoid Them

sgEngage

Without that, the SOA can misrepresent the financial health of the organization and lead to future funding issues. Often, this leads to large audit adjustments, budget vs actual reporting difficulties, and other funding challenges. Broadly grouped expenses or revenues can obscure the allocation of funds across different programs.

article thumbnail

10 Donation Page Best Practices for Nonprofits

Nonprofit Tech for Good

A good example of a donation page with proper branding is the World Wildlife Fund’s primary donation page : Accepting PayPal in addition to credit cards is a good idea to accommodate those donors that prefer to give through PayPal, but don’t make all donors use PayPal. 4) Experiment with default donation amounts.

Practice 363
professionals

Sign Up for our Newsletter

This site is protected by reCAPTCHA and the Google Privacy Policy and Terms of Service apply.

article thumbnail

How to Tell Your Donors Where Their Money Is Going

NonProfit Hub

If you want to go the extra mile, you can create charts and graphs that show how you allocate funds. For example: “Why are so many of your funds being spent on administration and supplies?”). So far, these tips have been very data-focused. Make it visual. You should also remind donors to keep the bigger picture in mind.

Money 64
article thumbnail

The Lurker to Contributor Ratio: Tagging Communities Compared To Other Online Communities

Beth's Blog: How Nonprofits Can Use Social Media

Chart from David White, JISC funded ???SPIRE??? project 2007 Survey , Via Stephen Downes comes a pointer to a David White's JISC funded ???SPIRE??? However, as Stephen notes, the data is very useful. Ha, I found something on page 8 and illustrated by the above chart. technologies.

Ratio 50
article thumbnail

Guest Post: Introducing the New GuideStar Nonprofit Profile

Beth's Blog: How Nonprofits Can Use Social Media

GuideStar’s vision is to drive philanthropy by increasing nonprofit data collection, distribution, and innovation. This means simple financial metrics will no longer be the primary focus when telling a nonprofit’s full story ( goodbye, overhead ratios !) Data is meaningless without context. It’s simple.

Profile 50
article thumbnail

The Overhead Solution: A New Nonprofit Pride Movement

Tech Soup

The CEOs of BBB Wise Giving Alliance, Charity Navigator, and GuideStar USA published a second open letter last year with the express goal to "crush" the overhead myth, the idea that overhead ratios should serve as the sole basis for evaluating nonprofit performance. Charity Raters Part 1: Charting the Bad and the Bad.

article thumbnail

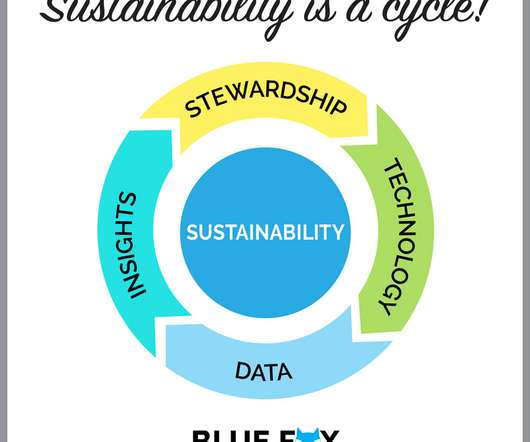
What Fuels Financial Sustainably? A Continuous Cycle of These 4 Elements

Blue Fox

We’re talking about a level of sustainability that most organizations only dream about: fully funded operating reserves, available lines of credit, multiple revenue streams, and a full understanding of when the money flows in, how to leverage it, make it grow, and how it is best spent. Data is a word used by proactive smart leaders.

Ratio 78