Remove Analysis Remove Data Remove Homeless Remove Sample
article thumbnail

Does your nonprofit mission statement drive donations?

Candid

New research conducted using data from Candid suggests that understanding this relationship can boost your nonprofit’s fundraising success. I was familiar with using data from Candid to evaluate a nonprofit as a prospective employee or when considering giving a donation—I love digging into a 990 ! For our second project,?

Donation 137
article thumbnail

Metrics for Building, Scaling, and Funding Social Movements

Beth's Blog: How Nonprofits Can Use Social Media

The report captures a conundrum in measuring social change movements or networked approaches. Outcomes for “ wicked problems ” can be easily counted – policies passed, housing the homeless, educating children. Research and policy analysis. Civic engagement. Leadership development. Alliance building.

Metrics 114
professionals

Sign Up for our Newsletter

This site is protected by reCAPTCHA and the Google Privacy Policy and Terms of Service apply.

article thumbnail

Technology & Community: Strategic Options for Building Movements

Amy Sample Ward

View more presentations from Amy Sample Ward. I like to think of it this way: Organizations may have the research or data, the capacity and staff, to identify problems and opportunities, to build messages, calls to action and campaigns. Post your data, share ideas that aren’t fully formed, discuss something by asking questions first.

Build 220
article thumbnail

10NTC Science Fair Preview - Giveaways, More Giveaways and Free Apple iPads

NTEN

Check out more awesome giveaways and highlights from a sampling of our exhibitors below. Want to know how non-profit organizations are using geographic analysis and the power of maps to support their missions, report to stakeholders and funders, apply for grants more effectively, or conduct fundraising and marketing gap analyzes?

Free 95
article thumbnail

10NTC Science Fair Preview - Giveaways, More Giveaways and Free Apple iPads

NTEN

Check out more awesome giveaways and highlights from a sampling of our exhibitors below. Want to know how non-profit organizations are using geographic analysis and the power of maps to support their missions, report to stakeholders and funders, apply for grants more effectively, or conduct fundraising and marketing gap analyzes?

Free 90
article thumbnail

The Evolution of NPTech: Keynote and slides

Amy Sample Ward

We had simple goals, and defined our metrics only as they related to grant deliverables or obvious data, like: we will launch programs in 3 schools, or we will feed 500 families. We use all of our technology – from the website, to the database, to facebook – to evaluate our efforts, monitor the community, and create data-driven strategies.

Slides 213
article thumbnail

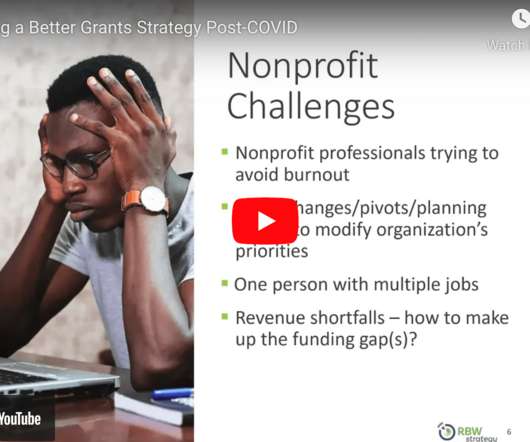
[VIDEO] Building a Better Grants Strategy Post-COVID

Bloomerang

And here’s just a sample breakdown, $56 billion for individuals and families, $86 billion for health, $211 billion for education and childcare, $40 billion for transportation. And the SOAR analysis, I think, is a great brainstorming tool because this can really incorporate feedback from all different folks.

Grant 114