Remove Adopt Remove Fund Remove Hurricane Remove Rate
article thumbnail

Philgorithms: Two Examples of Data Mapping to Guide Donor Decisions

Beth's Blog: How Nonprofits Can Use Social Media

We are seeing it to help donors make decision about COVID funding and other disaster related donation decisions. The interactive mapping tool harnesses COVID-19 incidence rates, community vulnerability scores, and detailed nonprofit profiles to help donors invest in the communities most affected by the pandemic.

Map 61
article thumbnail

How Text Messaging Has Revolutionized Giving

BoardAssist

Perhaps that voice in 2017 will be to help your nonprofit adopt text messaging as a new way of fundraising. Nonprofits who have adopted texting campaigns find it to be an effective, low-cost marketing method that yields impressive results. The average mobile pledge fulfillment rate is 84 per cent, which is aided by SMS reminders.

Giving 49
professionals

Sign Up for our Newsletter

This site is protected by reCAPTCHA and the Google Privacy Policy and Terms of Service apply.

article thumbnail

Even Storms Bear Fruit: Monumental Fundraising Opportunities For Food Banks In The Post-COVID Era

sgEngage

In short, we were caught in a hurricane of uncertainty. Their donations may seem small, but the steady funding it provides not only gives your organization a stable, reliable base, but lays an important step in moving donors to become middle donors – or even better, major donors years from now! But even storms can bring prosperity.

article thumbnail

Beyond Survival: Post-Disruption Nonprofit Digital Strategy

Bloomerang

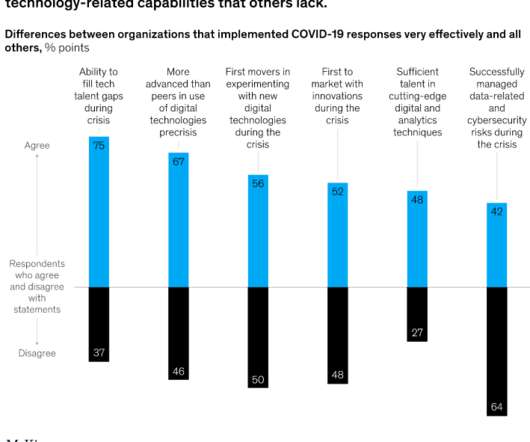
A new survey from McKinsey finds responses to the Covid-19 pandemic sped business adoption of digital technologies by several years—and many of these changes will likely be here for the long haul. Survey results suggest a seven-year increase, on average, in the rate at which companies are developing digital products and services.

Digital 121
article thumbnail

Online Giving Trends from 2009 and the Haiti Earthquake

NTEN

Even though February was the smallest month for online giving the first three months of 2009 had a 60% year-over-year growth rate in online revenue. These nonprofits had a 21% year-over-year median growth rate in online revenue. The two largest months for online giving were December and May. Year End Online Giving Trends.

Haiti 82
article thumbnail

Online Giving Trends from 2009 and the Haiti Earthquake

NTEN

Even though February was the smallest month for online giving the first three months of 2009 had a 60% year-over-year growth rate in online revenue. These nonprofits had a 21% year-over-year median growth rate in online revenue. The two largest months for online giving were December and May. Year End Online Giving Trends.

Haiti 68
article thumbnail

Citizen Tech: Social Media in Disaster Response

Amy Sample Ward

Another direct content example is that of the number of websites that emerged post-Hurricane Katrina. About 79 percent of the funds spent or committed by the American Red Cross have been for food and water; 18 percent have been for shelter; and the rest have been for health and family services.&#

Disaster 206