Remove Analysis Remove Homeless Remove Map Remove Metrics
article thumbnail

Fundraising Lessons from the Father of Advertising | Ogilvy on Fundraising

Whole Whale

Surveys, interviews, and data analysis can reveal the equivalent of that Rolls-Royce insight – the key emotional triggers, values, and desires of your existing and potential supporters. A charity combating homelessness should feature stories of providing shelter, not just cute mascots. This was an epiphany for Ogilvy.

Lesson 59
article thumbnail

Technology & Community: Strategic Options for Building Movements

Amy Sample Ward

The organizations get to do everything BUT drive: you are the vehicle, the gas, the map, the snacks even! So they provide the examples and maps, but they let the youth pick and pledge whatever it is they want to do to make a difference. Look first at your organizational metrics. Quite the opposite. What does it look like?

Build 220
professionals

Sign Up for our Newsletter

This site is protected by reCAPTCHA and the Google Privacy Policy and Terms of Service apply.

article thumbnail

Reflections from Networked Nonprofit Workshop for 300 People

Beth's Blog: How Nonprofits Can Use Social Media

I started experimenting with these concepts back in 2008 at SXSW session on Nonprofit ROI and SXSW Session on Nonprofit Crowdsourcin g as well as at the NTC in 2009 on a session mapping metrics to strategy. Some analysis questions: What points were the participants in the room tweeting?

article thumbnail

The Evolution of NPTech: Keynote and slides

Amy Sample Ward

We had simple goals, and defined our metrics only as they related to grant deliverables or obvious data, like: we will launch programs in 3 schools, or we will feed 500 families. Our strategies are focused on clear goals and metrics. In the social period, we began exploring the network – mapping it, evaluating it, testing it.

Slides 213
article thumbnail

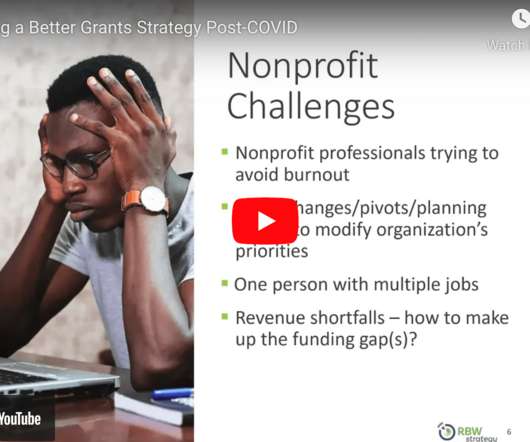
[VIDEO] Building a Better Grants Strategy Post-COVID

Bloomerang

And I want you to also look at logic model sample and a SOAR analysis because that could really kind of help you think through some of the priorities in the planning exercises. . You have the whiteboard that you can map them out. So logic model, this is my tried and true. I love this logic model. So thanks for sharing that.

Grant 114