Remove America Remove Chart Remove Google Remove Map
article thumbnail

14+ Excellent Nonprofit Annual Reports

Whole Whale

However, throwing a million charts and graphs together or writing a 10,000-word essay on why your nonprofit is the best isn’t going to be so effective (or worth anyone’s time). We love how Girls Who Code built an interactive map of the U.S. Donate Life America. Full disclosure: Donate Life America is a client of Whole Whale.).

Report 85
article thumbnail

Building the Tech Capacity of Nonprofits Everywhere with TechSoup's NetSquared Events

Tech Soup

The targets need to be linked like so: --> Jump to events in North America or go international with events in. Central and South America. TARGET END LINKS. ## Central and South America. ## North America. ## Africa. ## Europe. ## Asia and Pacific Rim. --> North America. Code for America Civic Hack Night.

professionals

Sign Up for our Newsletter

This site is protected by reCAPTCHA and the Google Privacy Policy and Terms of Service apply.

article thumbnail

Data and Storytelling: 6 Ways to Use Data to Move Your Mission

NTEN

By using the simple metaphor of t-shirt size to represent a US State's obesity rate, and making them “grow” over a two decade period - we can quickly see how America's waistline has ballooned in since 1987. My favorite example of this technique is the Descry Project's Obesity Epidemic visualization. Tell Your Story, Literally!

Data 100
article thumbnail

Data and Storytelling: 6 Ways to Use Data to Move Your Mission

Forum One

By using the simple metaphor of t-shirt size to represent a US State’s obesity rate, and making them “grow” over a two decade period - we can quickly see how America’s waistline has ballooned in since 1987. Focus the Story. We touched on this principle above. Tell Your Story, Literally! What are you waiting for?

Data 68
article thumbnail

Data and Story Telling: 6 Ways to Use Data to Move Your Mission

Forum One

By using the simple metaphor of t-shirt size to represent a US State’s obesity rate, and making them “grow” over a two decade period - we can quickly see how America’s waistline has ballooned in since 1987. Focus the Story. We touched on this principle above. Tell Your Story, Literally! What are you waiting for?

Data 67
article thumbnail

Data Portability for Good

NTEN

Along with 3 colleagues, we volunteered to develop an entry for the Apps for America 2 contest , sponsored by the Sunlight Foundation. The result displays in table format as well as visualized on an interactive shaded map of the US. Michaela Hackner and Sandy Smith, Forum One Communications. Fortunately, simply choosing Save As.

Data 82
article thumbnail

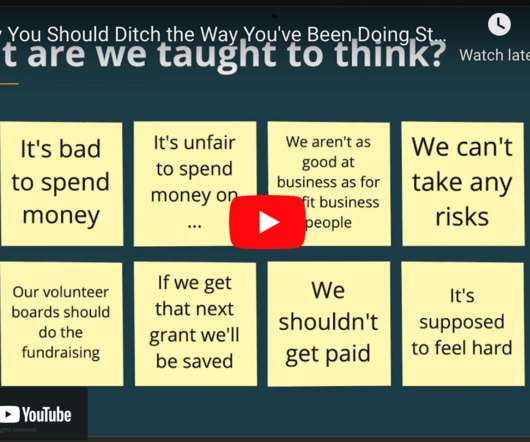
[VIDEO] Why You Should Ditch The Way You’ve Been Doing Strategic Planning

Bloomerang

Because it’s scary for me to say, because there is a whole world of articles you can Google right now that say, “The board’s responsible for making strategic decisions.” Google should be looking to you to learn how to do business better, not the other way around. . ” I got some followers. Yay, Aussies.

Video 94