Remove Chart Remove Disaster Remove Global Remove Philanthropy
article thumbnail

Where are the 2019 (and 2020) 990s? On filling the gaps in Candid’s grants data

Candid

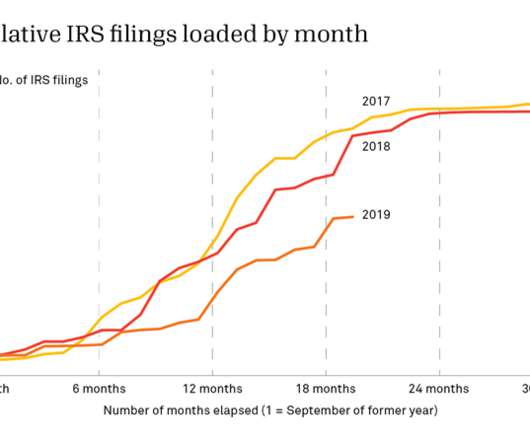
At Candid, grants data from 990s flows into tools such as Foundation Directory , public dashboards that provide insights into philanthropy in different regions across the U.S., As the charts below illustrate, we’re far from having comprehensive data for 2019, let alone 2020. A status update on filings.

Grant 141
article thumbnail

Introducing the 2021 Classy Awards Leadership Council

Classy

Brings a strategic focus on addressing the policies and systems that perpetuate global poverty . Chief Philanthropy Officer. Vice Chairman, Philanthropy.

Award 57
professionals

Sign Up for our Newsletter

This site is protected by reCAPTCHA and the Google Privacy Policy and Terms of Service apply.

article thumbnail

Research Friday: Generosity Expanded: The Impact!

ASU Lodestar Center

This level of increased global philanthropy is worth a further look. The Hudson Institute’s Center for Global Prosperity recently published its Annual Index of Global Philanthropy and Remittances for 2010 and reported “financial flows to the developing world from the United States increased notably in 2010 to $326.4

article thumbnail

NpTech Tag Summary: Penguin Day in New Orleans, Fondling the Tools, and More

Beth's Blog: How Nonprofits Can Use Social Media

Via NTEN blog Google moves one step closer to making desktop applications obsolete with the release of the Google Chart API. Philanthropy, Fundraising, Disasters, and Video Good corporate citizenship was highlighted at Davis this past week. ") Okay, now we're onto fondling APIs, google's to be exact.

Summary 50
article thumbnail

Nonprofit Technology News Celebrity Forecasts for 2014

Tech Soup

We have certainly seen some examples of maps or charts that the user can interact with, but with the over saturation of static infographic images, 2014 and the plethora of tools emerging that make these options really easy, we will see more organizations using data for storytelling that users can watch, click on, and really explore.