Remove Blog Remove Chart Remove Data Remove Metrics
article thumbnail

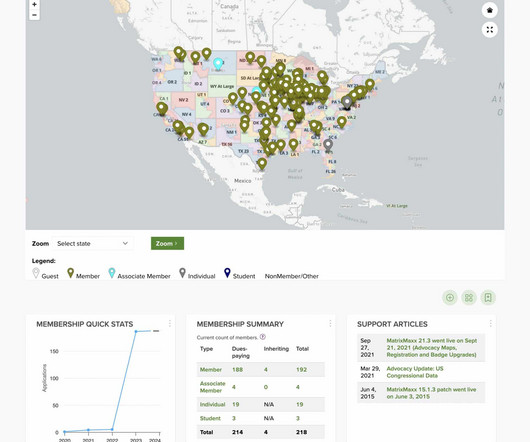
MatrixMaxx 24.1 Release is Full of Visualizations and Dashboard Enhancements

The MatrixFiles

of MatrixMaxx , a leading Association Management System (AMS) that helps trade associations and professional societies manage their organizations better, have great member journeys, and be higher performing through data. There are more changes than we can cover in one blog post, but we would love to highlight some of our favorites.

Module 130
article thumbnail

Who is sharing nonprofit demographic data with Candid? 

Candid

Since 2014, Candid has been collecting demographic data about the people who work at U.S. To date, over 54,000 organizations have shared some data about how their staff and/or board identify by race/ethnicity, gender, sexual orientation, and/or disability status. Demographic data sharing varies by nonprofit subject category.

professionals

Sign Up for our Newsletter

This site is protected by reCAPTCHA and the Google Privacy Policy and Terms of Service apply.

article thumbnail

Integration: The Ultimate Solution for Nonprofit Data Silos

sgEngage

Many nonprofits struggle to maximize their data usage. In fact, when surveyed, 97% of nonprofit professionals expressed an interest in learning how to use their data more effectively, and only 5% reported using data in every decision they make. So, how do healthcare organizations overcome these data silos?

article thumbnail

5 Tips for Community Health Centers to Transition to New Fund Accounting Software

sgEngage

You need data collection and data structure skills, not just a data entry person—someone who knows how your organization operates and the best ways for information to be delivered. This person shouldn’t be the clerical or data entry person. Determine the non-financial metrics you want to track.

Fund 95
article thumbnail

Information: The Better Half of IT

sgEngage

As a Database Administrator, my world revolves around helping users make sense of the information they receive, from voice-of-the-customer anecdotes and impressions to polished Key Performance Indicator (KPI) graphs, charts, and dashboards. Why pay attention to data? Data is valuable! Data fuels most activities in a nonprofit.

Chart 87
article thumbnail

New year, new social media plan: Using data to inform our strategy 

Candid

I selected those metrics because our goals for social media are to increase brand awareness and drive traffic to our articles and resources. You also love a nice chart. We get it, who doesn’t love data presented in a nice visual format? We get it, who doesn’t love data presented in a nice visual format?

article thumbnail

If a Metric Changes on a Spreadsheet and No One Notices, Does it Show Impact?

Amy Sample Ward

This post originally appeared on the NTEN blog – you can also read the full post and join the conversation on the NTEN.org website. —– I love data as much as the next person. Give me an interactive map, a pivot table, even a plain old pie chart and I’m happy. Is data helpful if you aren’t using it?

Metrics 158