article thumbnail

Mastering Next Year’s Budget With Revenue Projections and Donor Attrition Analysis

Neon CRM

Understanding Revenue Projections When a nonprofit is putting together a budget for the coming year, an important step is to perform a revenue projections analysis that can inform the expected amount of income used for operational expenses and deepen mission impact.

article thumbnail

Check it out, mate! The 2024 M+R Benchmarks Study is here!

M+R

Visit mrbenchmarks.com now to explore all the charts, analysis, insights, and more! Here’s a small sample of what you’ll find: Average online revenue declined by 1% in 2023, while direct mail revenue fell by 6%. The latest edition of the annual M+R Benchmarks Study has arrived, and here’s your ticket to ride. Sign up now!

professionals

Sign Up for our Newsletter

This site is protected by reCAPTCHA and the Google Privacy Policy and Terms of Service apply.

Trending Sources

article thumbnail

Come and get it! The 2023 M+R Benchmarks Study is served!

M+R

The maître d’ has called your name, the table is set, and the napkins are folded up like fancy little swans: it’s time to dig in to a year’s worth of M+R Benchmarks charts, findings, and insights at mrbenchmarks.com ! Email generated 14% of all online revenue. Also: we say goodbye to open rates!

article thumbnail

Your journey awaits: The 2022 M+R Benchmarks Study is here

M+R

Go explore the findings, charts, and analysis at mrbenchmarks.com. . Total online revenue for nonprofits increased by 3% in 2021 , building on runaway growth for many sectors during the first year of the pandemic. Monthly giving increased by 24% , and accounted for 22% of all online revenue in 2021. Read time: 2 minutes.

article thumbnail

Cheap and Cheerful Audience Analysis for Nonprofits

Beth's Blog: How Nonprofits Can Use Social Media

So, was delighted when Darren Barefoot asked if he share a guest post about how to do audience analysis. Cheap and Cheerful Audience Analysis for NGOS by Darren Barefoot. But not all kinds of audience analysis are evil. Create a heat-map to show them where they live, or a series of charts to breakdown their values.

Analysis 105
article thumbnail

Highest Online Donations for Nonprofits in 2016

Tech Soup

In 2016, overall charitable giving increased 1 percent and online giving was up 7.9 These results are based on the largest analysis of charitable giving data and come from the 2016 Charitable Giving Report. Online giving grew 7.9 Online donations were 7.2 GivingTuesday online donations were up 20 percent in 2016.

article thumbnail

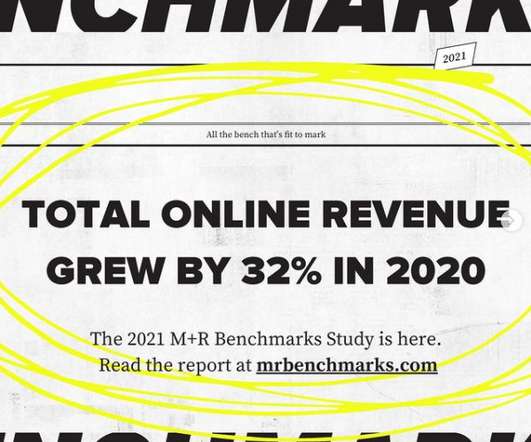
Read all about it: The 2021 M+R Benchmarks Study is here

M+R

Go explore the findings, charts, and analysis at mrbenchmarks.com. . Online revenue for nonprofits increased by 32% in 2020. Here: Nonprofits working to alleviate Hunger and Poverty reported a 173% increase in online revenue. Read time: 2 minutes. For now, here’s some quick news you can use: . Want more evidence?