Remove Benchmark Remove Facebook Remove Nonprofit Remove Twitter
article thumbnail

10 Twitter Best Practices for Nonprofits

Nonprofit Tech for Good

This is the ninth post in a blog and webinar series called 101 Digital Marketing Best Practices for Nonprofits , written and presented by Heather Mansfield. Please sign up for Nonprofit Tech for Good’s email newsletter to be alerted of new posts. Related Webinar: Social Media Best Practices for Nonprofits.

Twitter 356
article thumbnail

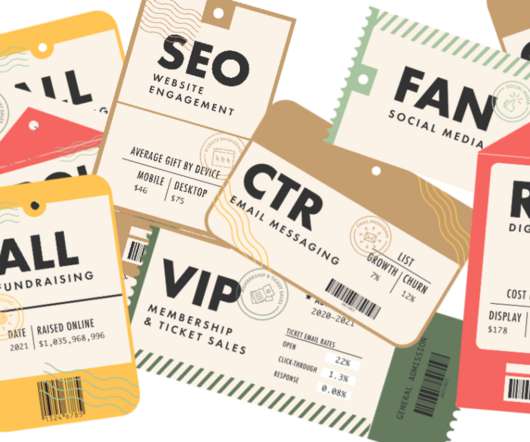
Come and get it! The 2023 M+R Benchmarks Study is served!

M+R

The maître d’ has called your name, the table is set, and the napkins are folded up like fancy little swans: it’s time to dig in to a year’s worth of M+R Benchmarks charts, findings, and insights at mrbenchmarks.com ! But the results for nonprofits in the Disaster/International Aid space looked very different.

Benchmark 100
professionals

Sign Up for our Newsletter

This site is protected by reCAPTCHA and the Google Privacy Policy and Terms of Service apply.

article thumbnail

2012 Nonprofit Social Networking Benchmark Report [INFOGRAPHIC]

NetWits

Blackbaud, NTEN and Common Knowledge just released the fourth annual 2012 Nonprofit Social Networking Benchmark Report. We learned a lot of things, but one prevailing theme stood out — despite limited budgets and staffing, nonprofits continue to find great value in their fast-growing social networks. Tweet It!].

article thumbnail

Extra Extra: the Benchmarks Webinar Recording

M+R

There’s no wrong way to dig into our annual Benchmarks Study, covering digital programs from marketing to fundraising to advocacy. Others prefer a sense of community and the chance to ask questions, and a few hundred of them joined us for a Benchmarks webinar yesterday. . Online revenue for nonprofits increased by 32% in 2020.

article thumbnail

82 Fundraising and Social Media Stats for Nonprofits

Nonprofit Tech for Good

53% of nonprofit staff who are extremely or somewhat satisfied in their current roles donate to the organization where they work ( World-Changing Work Report ). 29% of annual donation volume to nonprofits occurs from #GivingTuesday through the end of the year. Email messaging drives 13% of all online revenue ( M+R Benchmarks Report ).

Stats 279
article thumbnail

Your journey awaits: The 2022 M+R Benchmarks Study is here

M+R

Pack your bags, lock your tray table, and fasten your seatbelt: the 2022 M+R Benchmarks Study is ready for takeoff. We’ve put a year’s worth of data from 187 amazing nonprofit partners through the X-ray machine, and we’re ready to take you on a tour of digital ads, social media, email, web traffic, and more. .

article thumbnail

Nonprofits Value a Facebook Like at $214.81

NetWits

I just returned from the Nonprofit Technology Conference (#12NTC) hosted by NTEN in San Francisco, CA. While we were there, Blackbaud, NTEN and Common Knowledge released the 2012 Nonprofit Social Networking Benchmark Report. Facebook Fan or Supporter). What this Means for Your Nonprofit. Key Information.

Facebook 241