Remove Comparison Remove Data Remove Information Remove Taxonomy
article thumbnail

Level Up Your Marketing with Analytics

Association Analytics

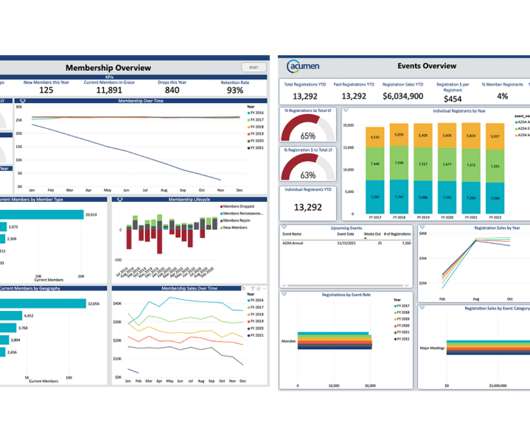
Fortunately, with data, we can better understand members’ behavior and which marketing channel is most effective to reach our members. In addition to the tools, a very important piece of successful marketing is Taxonomy & Metadata – the foundation of your marketing. This is how you organize and describe your data.

Analytics 169
article thumbnail

A crash course on trends analysis using Candid’s Foundation 1000 data set 

Candid

One of the most common reasons people analyze Candid’s grant data is to understand year-over-year giving trends in the sector. To do so, it’s easy to assume that the best place to start is with as much data as possible. Instead, we rely on a data set called the Foundation 1000. What is the Foundation 1000?

Analysis 105
professionals

Sign Up for our Newsletter

This site is protected by reCAPTCHA and the Google Privacy Policy and Terms of Service apply.

article thumbnail

Who is sharing nonprofit demographic data with Candid? 

Candid

Since 2014, Candid has been collecting demographic data about the people who work at U.S. To date, over 54,000 organizations have shared some data about how their staff and/or board identify by race/ethnicity, gender, sexual orientation, and/or disability status. Demographic data sharing varies by nonprofit subject category.

article thumbnail

Guest Post by Stephanie McAuliffe: SoCap09 - Day 2 Roundup

Beth's Blog: How Nonprofits Can Use Social Media

People are open sourcing their metrics, and building taxonomy. To get the market from niche to mainstream people are working on taxonomy, metrics and peer and trend ratings. The taxonomy of social and environmental terms enables the aggregation of data from different providers and multiple data collection systems. “ .

article thumbnail

Mapping funding for racial justice: A political imperative

Candid

These categories build off of the extensive taxonomy Candid has developed over years—based on data from over 17 million grants—which we have jointly adapted to capture work related to human rights. Looking across years and areas illuminates trends, uncovers gaps, and provides comparisons within the field. Even in the U.S.,

Map 96