Remove Analysis Remove Information Remove Organization Remove Taxonomy
article thumbnail

A crash course on trends analysis using Candid’s Foundation 1000 data set 

Candid

Why we use the Foundation 1000 sets for trends analysis As illustrated in the chart above, the Foundation 1000s’ grantmaking is much more stable over time compared to the broader grant data set. Additionally, the Foundation 1000 contains information about a narrower band of giving: grantmaking by foundations. Pledges are excluded.

Analysis 116
article thumbnail

Top Ten Data Challenges (And Solutions) for Associations

Association Analytics

Sometimes this feeling can leave you wondering where or how to start organizing your data, which can easily lead to a cycle of inaction and increased overwhelm. This leads to better communication, and over time, a more organized set up so you won’t be overwhelmed by where to go for the data you need in the moment. credits offered).

professionals

Sign Up for our Newsletter

This site is protected by reCAPTCHA and the Google Privacy Policy and Terms of Service apply.

article thumbnail

Who is sharing nonprofit demographic data with Candid? 

Candid

To date, over 54,000 organizations have shared some data about how their staff and/or board identify by race/ethnicity, gender, sexual orientation, and/or disability status. i We anticipate a steady increase in organizations sharing demographic information as a result of our recently launched Demographics via Candid campaign.

article thumbnail

Auto Taxonomy Updates for Call Centers

VisionLink

We have released an updated version of our auto-update solution to ensure that the categories through which you manage your resource directory are aligned with the ever improving AIRS taxonomy. For more information about activating this feature switch on your VisionLink CommunityOS system, please contact our help desk.

Taxonomy 100
article thumbnail

Which Social Networking Analysis Term Best Describes Virgin America?

Beth's Blog: How Nonprofits Can Use Social Media

This is a post to help me identify what I don't know about social network analysis and mapping tools with the hope that you'll fill in the gaps in the comments. Information flows. Think of a Tower-like organization where staff aren't encouraged to network or within siloed departments.) Source: Monitor Institute.

article thumbnail

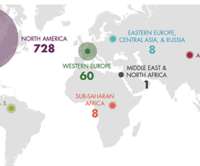
New and Improved Data Visualization Tool: Maps for Media Funding

Beth's Blog: How Nonprofits Can Use Social Media

Subject Area: View the distribution of a specific organization’s funding by subject areas, including an “and/or” search function. This like doing a landscape analysis with a simple click! Many projects and organizations that address big hairy problems such as poverty, healthcare access, and others often include a media component.

Map 76
article thumbnail

So Now What? Finding Funding for Your Nonprofit

Tech Soup

If your organization is like those of many of our respondents, there is never enough time or staff to devote to grantseeking. And because a lot of these organizations are controlling administrative costs by cutting staff, there just isn't much time for additional research. Do you think of your organization as rural?

Fund 62