article thumbnail

Information: The Better Half of IT

sgEngage

As a Database Administrator, my world revolves around helping users make sense of the information they receive, from voice-of-the-customer anecdotes and impressions to polished Key Performance Indicator (KPI) graphs, charts, and dashboards. Data gives us context. How do I care for my data? That’s okay!

Chart 84
article thumbnail

The Better FAFSA: What Colleges Need to Know Right Now

sgEngage

Department of Education released look-up tables to help students determine their estimated Pell Grant amounts prior to completing their applications. Timing: With affordability as a primary concern of higher education applicants, schools that get financial aid packages to students more quickly may be more successful recruiting those students.

Student 86
professionals

Sign Up for our Newsletter

This site is protected by reCAPTCHA and the Google Privacy Policy and Terms of Service apply.

article thumbnail

7 Social Media Toolsets for 2016 by @jeremycaplan

Beth's Blog: How Nonprofits Can Use Social Media

Jeremy Caplan is the Director of Education, Tow-Knight Center Entrepreneurial Journalism and an amazing teacher. A stellar example of content curation : Content curation is not aggregation or a big gigantic list of links. A content curator v ets, filters, organizes, and presents information in a instructional way.

article thumbnail

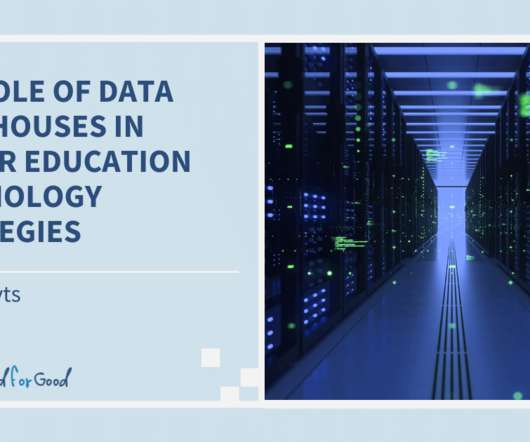
The Role of Data Warehouses in Higher Education Technology Strategies

Cloud 4 Good

But what about higher education institutions? . Higher Education Data Warehousing Use Cases. Higher education institutions have an inherently high volume of data generated through the recruiting and admissions processes. Generally, the information is valuable in the aggregate but not at the individual detail level. .

article thumbnail

Reporting for Grantmakers: Charts vs. Lists to Make Sense of Your Data

sgEngage

Charts and lists are two of the most common formats for grant reporting, but they have different benefits when you are trying to make sense of your grantmaking data. Using Charts in Your Grant Reporting. Charts make it easy to make sense of a lot of data by creating context. That’s where a list format would be more valuable.

Chart 76
article thumbnail

NTEN Member Buzz Round-Up: Jan 22nd

NTEN

aggregates resources in nonprofit technology topics. want to hear about how you've leveraged social media for your organization's PROGRAM work : advocacy, education, or delivering your mission. and provides important information you should know if you're considering using mobile fundraising for your organization. ") Answr.net.

NTEN 52
article thumbnail

Data and Storytelling: 6 Ways to Use Data to Move Your Mission

NTEN

These days everyone is releasing it, visualizing it, aggregating it, and mashing it up. CUP is a New York City based organization that educates and informs the public, educators, and policy makers to help them make smarter urban growth decisions. By Kurt Voelker, CTO, Forum One Data is the new black. And for good reason.

Data 100