Blog Insights
Year-End Reporting: Data-Driven Ways to Tell Your Story
Though annual reports can come at any time, a key component of finishing the calendar year off strong is to ensure that you are reporting on what you’ve achieved and identifying where there is room to grow.
As you get started on sifting through your data reports and action items completed this year, keep an eye on how your internal and external reports can blend data-driven stories of impact.
When it comes to your reporting strategy, it’s important to keep in mind who your key stakeholders are, and how can you package your data and results in a way that speaks to them directly. Some of the biggest reporting challenges for nonprofits, associations, and foundations include:
- Where to get the data: Some data is found easily in data dashboards, some is not. Knowing where and how to access the full package of data to even begin to review it is a real challenge, especially when data platforms aren’t connected to one another or aren’t online.
- How to glean insights: Having the data is one thing, but knowing what insights to pull with confidence that it is the right picture is quite another.
- How to format the results: Presenting data findings in a way that makes sense and allows stakeholders to take action is extremely difficult, especially when stakeholders differ in their focus and approach across an organization.
Start with the goals you’ve already set
Before searching for data, start with your Key Performance Indicators (KPIs). What have you been tracking, and where do you stand on those goals?
If you haven’t defined KPIs for the year, or at least been specific enough in your targets, get a baseline of where you are now so that you’re in better shape for next year. Setting your goals first allows you to anchor a reference point for success.
You can also look back at where you were at this point a year ago, and take some insights from there. Regularly monitoring performance metrics or KPIs throughout the year allows you to know what you need. Then you can begin looking at your data with a direction and purpose in mind.
Analyze with actionable data in mind
Once you have the numbers, how do you know which numbers matter more, and how to glean insights? Goal setting matters a lot here. And, don’t only select the data points that are working; show what isn’t to make the case for resources for next year.
The goal with your analysis is to have actionable data. Data that helps you make a decision, refine your strategy, or optimize a channel. If you can’t do something with the data, it’s not supporting the story you need it to tell.
Format for your stakeholders’ preferences and needs
Once you have a good sense of your analysis and recommendations, you need to think about how you package it for different decision makers. This might seem like the last thing you have time for; however, it is critical because how it is received strongly influences future decisions around budgeting, staffing and other resourcing going into next year.
You want to strike a balance between highlighting success and showing where you need to go next, while not overwhelming your audience in the process. To do this effectively, it’s important to have a good understanding of communication preferences as well as methods and levels of data comfort for different groups of stakeholders. Here are three report formats we recommend:
For your team
Focus on what you need for your team to be able to understand success and plan ahead. The key is to provide actionable data that will allow you to optimize and prioritize. Often, this is a much more in-depth and detailed report that you use to compare against various KPI targets.
For your departmental leadership
Focus on what your departmental leadership needs to understand and support your growth. This is likely a combination of detailed information about what is or isn’t working particularly well, and a higher-level overview of your activities. The goal is to enable these individuals to advocate for more resources or changes in strategy.
For your executive leadership
Focus on what your executive and board leadership need to understand to make resourcing decisions. Often, this is a high-level report, focused on strategic, organization-wide metrics of success. This is where telling a story with your data is really valuable.
Find inspiration for external audiences
While internal audiences are the target for KPIs and data analysis discussed, what can you take from this process into an annual or impact report? Far from the dense printed annual reports of the past, most organization’s reports are now fully digital, engaging, and data-driven.
Whatever shape it takes, your annual report is both the moment to tell your nonprofit’s story of impact over the last year and a major opportunity to increase engagement and excitement in your mission for years to come.
As you dig into your 2023 annual report planning process, here’s some inspiration from different mission-driven organizations with highly effective approaches.
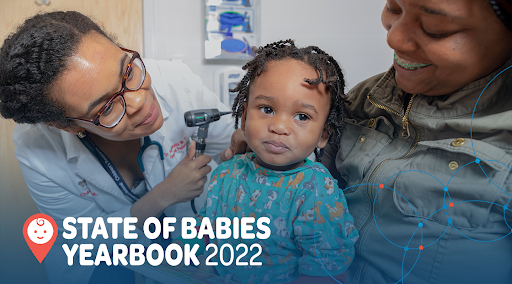
The State of Babies Yearbook is an interactive web platform that educates public and political leaders about the unique developmental needs of babies and toddlers and advances policy solutions to support and strengthen families. Data visualizations and graphics that highlight important indicators that contribute to the development of and outcomes for millions of babies.
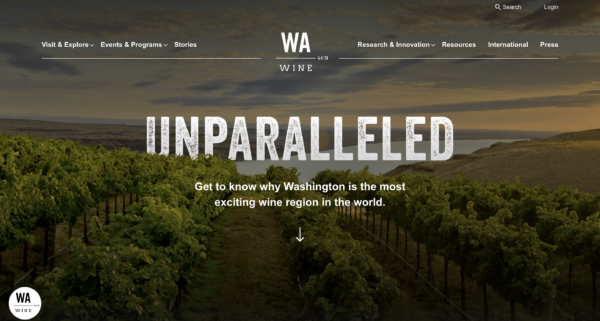
The Washington State Wine Commission facilitates an annual report completed by member winery or vineyards to collect data on the amount of grapes grown and wine produced to further report on grape cultivation and wine production in the State.
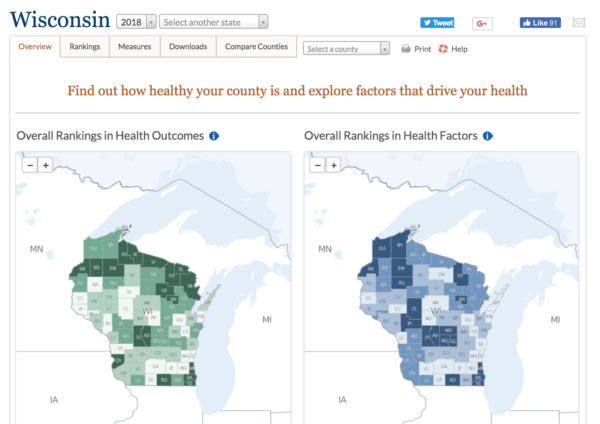
County Health Rankings & Roadmaps uses responsive, sophisticated data visualizations and maps to show how where we live matters to our health.
Effective year-end reporting involves blending internal and external data to showcase achievements and growth opportunities. Clear Key Performance Indicators (KPIs) are crucial for meaningful analysis. Tailoring reports to different audiences strikes a balance between celebrating success and planning for the future.
Learning from impactful organizations like The State of Babies Yearbook and County Health Rankings & Roadmaps demonstrates the power of data visualization in conveying compelling narratives. As annual reports shift to digital formats, they become not only reflections but also drivers of engagement and mission advancement.