Did nonprofit leadership become more racially diverse after 2020?

Since 2020, we’ve seen a greater sense of urgency to address racial inequities in the social sector—especially around access to power and resources. As the largest source of nonprofit demographic data, at Candid we’re often asked whether this push has resulted in actual change. Are more people of color serving in nonprofit leadership roles? Have we closed the racial leadership gap?
The answer is…yes and no. For this article, we use our archival demographic data to examinei whether there has been an increase in racial diversity among nonprofit leaders between 2020 and 2023. Here are our top three takeaways.
1. There were no major shifts in the overall racial representation of nonprofit CEOs at the sector level
Looking at each year of data in aggregate, the racial distributions of nonprofit CEOsii remained consistent from year to year. Nonprofit CEOs are predominantly white: More than 70% of organizations are led by a white CEO. On average, only 13% of nonprofit CEOs identify as Black/African American, while just 6% are Hispanic/Latinx and 4% are Asian American/Pacific Islander. Native American is the least represented race/ethnicity, accounting for less than 1% of CEOs each year.

| Number of organizations | ||||
| Leader Race | 2020 | 2021 | 2022 | 2023 |
|---|---|---|---|---|
| Black/African American | 1,057 | 3,114 | 3,954 | 4,499 |
| Hispanic/Latinx | 488 | 1,339 | 1,682 | 2,008 |
| Multi-racial/Multi-ethnic | 269 | 804 | 1,039 | 1,155 |
| Native American | 72 | 210 | 250 | 294 |
| Asian American/Pacific Islander | 311 | 999 | 1,240 | 1,410 |
| White | 5,376 | 18,723 | 22,026 | 24,138 |
Figures represent numbers of organizations for which the CEO identifies as a given race/ethnicity. For each year, we excluded nonprofits that skipped the question or declined to share their leader’s race/ethnicity as well as those whose leader’s race/ethnicity did not fall into one of the six categories.
2. Roughly 2% of organizations indicated a change between BIPOC, white, and other leaders each year
Our first analysis suggests that the sector overall has not become more racially diverse. However, because CEO tenure tends to be lengthy, it is possible that there are some shifts happening that simply are not yet noticeable in aggregate at the sector level. To explore this possibility, we also examined how the leader’s race changed within each organization between 2020 and 2023.
For simplicity, we categorized the CEO races and ethnicities between BIPOCiii (Black, Indigenous, or people of color), white, and otheriv and analyzed changes between those three categories within each organization. We limited the analysis to nonprofits that shared information about their leader’s race at least twice between 2020 and 2023 and excluded those that skipped the question or declined to state their leader’s race/ethnicity. Our final data set included 28,669 organizations, of which 17,688 shared their leader’s race/ethnicity information in two of the four years, 8,710 did so in three years, and 2,271 did so in all four years.
Overall, we found that for each year, about 2% of organizations in this data set reported shifts between the categories of BIPOC, white, and other. (Actual CEO turnover may be higher, as this analysis does not capture, for example, a white CEO replacing a white CEO).
| Change in organization leaders’ race | Change 2020-2021 | Change 2021-2022 | Change 2022-2023 | |||
|---|---|---|---|---|---|---|
| CEO race change (BIPOC/white/others) |
number | percentage | number | percentage | number | percentage |
| Yes | 89 | 1.81% | 334 | 2.49% | 345 | 2.14% |
| No | 4,822 | 98.19% | 13,062 | 97.51% | 15,778 | 97.86% |
3. When there was a change between BIPOC, white, and other, it was often a shift from a white CEO to a BIPOC CEO
Among the approximately 2% of organizations that saw a change in their leader’s race, the majority reported a shift from a white leader to a BIPOC leader. While between 2020 and 2021, 44% changed from a white CEO to a BIPOC CEO, in subsequent years, more than 60% of organizations that saw a change indicated a shift from a white CEO to a BIPOC CEO.
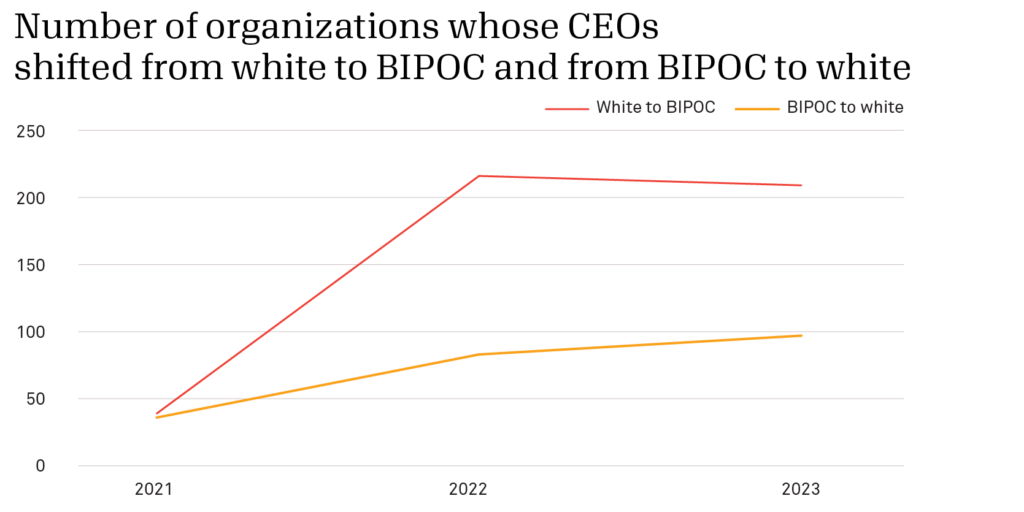
We excluded the change in race between other and BIPOC or white. Figures represent changes in nonprofit leadership from the previous year to the year provided.
In short, there is no simple answer to the question: “Did nonprofit leadership become more racially diverse after 2020?” On the one hand, our analysis suggests that the overall racial distribution of nonprofit CEOs has remained constant over the past four years, with more than 70% of CEOs in the sector identifying as white. On the other hand, when we narrow our focus to the 2% of organizations with new CEOs of a different race, we see that in 2022 and 2023, there were twice as many organizations that hired a BIPOC CEO upon the departure of a white CEO, as those that hired a white CEO upon the departure of a BIPOC CEO. This analysis leaves us cautiously optimistic that we are starting to see changes when it comes to racial diversity in nonprofit leadership. Only time—and more data—will tell whether these small shifts will lead to systemic change.
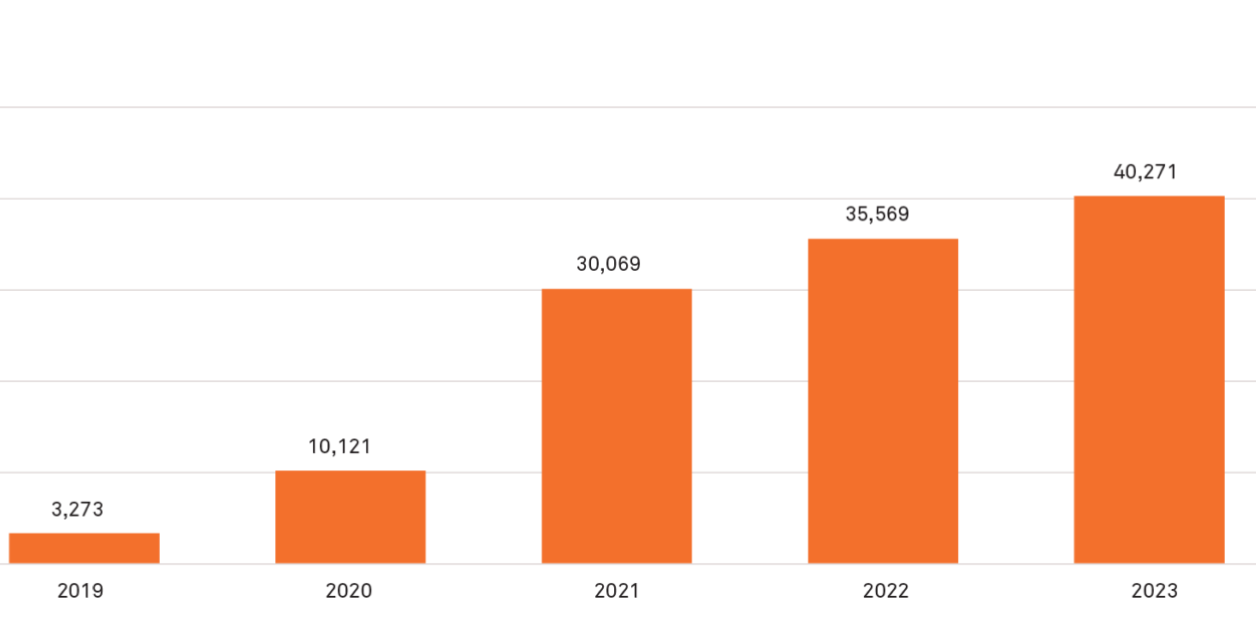
iWe limited the analysis to 2020-2023 because in 2019, only 3,273 nonprofits shared their demographic information with Candid.
iiAbout 19% of organizations in our dataset have both a leader and a co-leader. For this analysis, we excluded data on co-leaders.
iiiBIPOC includes people who publicly identify as Asian/Asian American/Native Hawaiian/Pacific Islander, Black/African American, Hispanic/Latino/Latina/Latinx, Multi-racial/Multi-ethnic (two or more races or ethnicities), and Native American/American Indian/Alaska Native/Indigenous.
ivSome respondents wrote in their leader race and we manually reviewed and assigned a category for those write-ins. There are cases where we could not determine a specific race where the write-ins could fit and kept them as ‘other.’
About the author

Related posts

Co-leadership: A path to more diverse, sustainable nonprofits?
Dig into insights on nonprofit co-leadership to find out whether this commonplace trend of charitable organizations led by two leaders is opening the door to more overall diversity in the sector.
April 17, 2024

Making meaning of Candid’s free demographic data set
Learn how to conduct research using our free demographic data set of over 62,000 nonprofits that’ve shared their data with Candid.
December 6, 2023
Looking back at five years of Candid’s demographic data collection
Drawing on five years of historical data collection, we share four key insights about the demographic information of nonprofits’ leadership and staff that’s been shared with Candid.
February 28, 2024

Doubling down on data for racial equity
Find out how demographic data collection via Candid profiles helps inform equitable grantmaking and reduce the reporting burden on nonprofits in this webinar recap.
April 4, 2024

What to know about U.S. nonprofit sector demographics
The state of diversity in the U.S. nonprofit sector, a new Candid report, offers baseline insights on the demographic makeup of today’s nonprofit staff, leaders, and board members.
May 16, 2024

Philanthropic collaboratives are finding ways to more effectively measure impact
Find out how philanthropic collaboratives—organizations that distribute resources from multiple donors to nonprofits—are finding new and effective ways to equitably measure impact across their portfolio of grantees.
May 13, 2024
Felina Martin says:
I appreciate the work behind this report Mantin. It is very validating for BIPOC working in the nonprofit sector. Thank you.
Mantin Diomande says:
Hi Mark, thank you for your comment!
It is true that our demographic data collection has grown dramatically in the last few years! That is why we've opted to include both numbers and percentages--to be transparent about our sample size, and because sample size doesn't impact percentages.
Additionally, for section 2 & 3, we aimed to create a consistent dataset by limiting the analysis to nonprofits that shared information about their leader’s race at least twice between 2020 and 2023, and only looking at changes within organizations rather than across organizations.
Finally, Candid is collecting data about disability! We've focused on race here because it's the part of our data that is most comprehensive and also what we get asked about most. In the future, we aim to share more about what we're learning about disability demographics, starting with our upcoming State of diversity report coming out next week.
mark carlson says:
Thanks for the article and analysis.
I'm not sure how an analysis can be made given the dramatic increases in collected data. The reported numbers have certainly increased and we assume are accurate. But without understanding if this has remained a consistent data set I'm not sure how any conclusions can be made.
Additionally, and once again, Candid is focused on racial diversity and ignore disability (sensory or physical). In my opinion, this segment is more closed to opportunity and you (and others) fail to shine a light on that challenge.
As a white male, MBA/PHD, 25 years of nonprofit CEO experience (under 55), who pivoted from a long tenure - my anecdotal evidence is that nonprofit boards and recruiters (esp. in the Northeast) are not entertaining conversations with white candidates regardless of qualifications or experience. I don't mean this as a gripe but just providing my real world experience.
MC
Christina Degbo says:
Would love to see a 10 year trend in the future! It's interesting to see the changes of CEO's from white to BIPOC, especially since so many organizations clients are BIPOC.
L. Brian Jenkins says:
Thank you for this report.
James Posner, Ph.D. says:
very interesting article. It does have to be statistically compelling, but can still facilitate some converations and thinking about the topic. drilling down in subsequent years will be interesting -- as the analysis can be expanded to georaphy/place and size of oganizations, etc. Perhaps also an analysis might check the form 990's and include composition of highly placed and highly compensaed leadership.
Wayne Ellis says:
Very informative analysis, continue to inform and educate.