A crash course on trends analysis using Candid’s Foundation 1000 data set

One of the most common reasons people analyze Candid’s grant data is to understand year-over-year giving trends in the sector. To do so, it’s easy to assume that the best place to start is with as much data as possible.
So, you may be surprised to learn that when we do trends analyses at Candid, we often don’t start with our full data set. Instead, we rely on a data set called the Foundation 1000. In this blog, we share a bit about what this data set is, why we use it, and how you can, too.
What is the Foundation 1000?
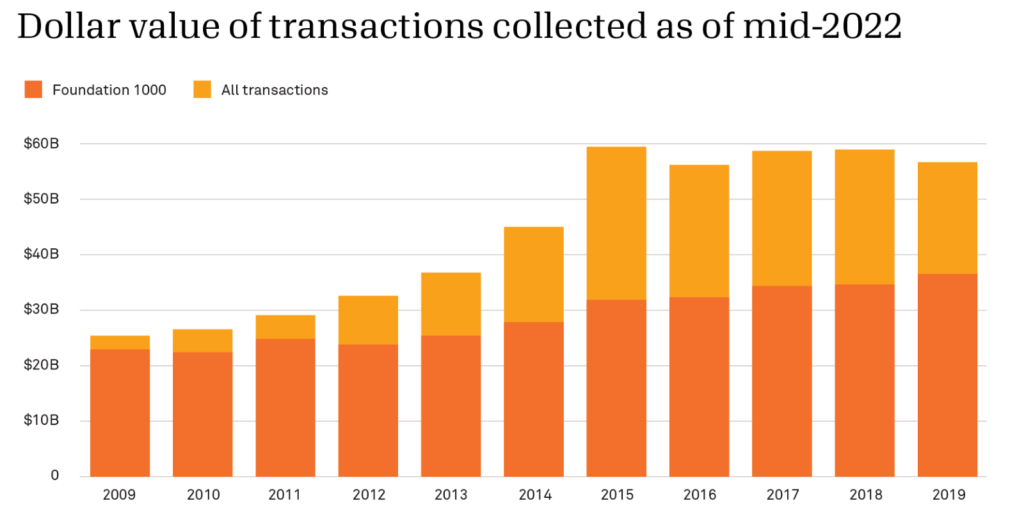
At Candid, we collect data on millions of grants and other transactions awarded by hundreds of thousands of funders across the globe. In comparison, our Foundation 1000 data set is limited to grants of $10,000 or more awarded by a set of 1,000 of the largest U.S. private and community foundations.i Even though the Foundation 1000 makes up only about 1% of U.S. funders, the donations from these 1,000 large foundations account for about 50-60% of the grants dollars Candid collects from U.S. foundations in a given year (see chart below).
Why we use the Foundation 1000 sets for trends analysis
As illustrated in the chart above, the Foundation 1000s’ grantmaking is much more stable over time compared to the broader grant data set. This is because Candid’s data collection efforts have increased a great deal over the years (particularly around 2013-2015). This means that if researchers simply look at all of Candid’s data on foundation giving, they risk inadvertently conflating an increase in data collection with an increase in giving. Because the Foundation 1000 always includes the same number of grantmaking organizations and a similar composition of foundations every year, it is a more accurate indicator of macro-level movement in the field.
Additionally, the Foundation 1000 contains information about a narrower band of giving: grantmaking by foundations. It does not include pledges, government funds, or donations from high-net-worth individuals or public charities (all of which are contained in our broader data set). Streamlining what data is included offers a cleaner, more apples-to-apples approach for those interested in understanding foundation giving.
Finally, because the Foundation 1000 represents a much smaller subset of grant data, it is possible to review the data more thoroughly. For example, we check that the grants we’ve collected represent a high proportion of a funder’s total giving (i.e., ensuring that the grants data is ‘complete’ for each funder included in the set). We also conduct manual review of the largest grants by dollar amount to ensure that they’ve been coded accurately (see more on this below.)
How we create the Foundation 1000 sets
The process of creating the Foundation 1000 set unfolds over a couple of years, as funders share their grants data with Candid and the IRS releases Form 990 and 990-PF filings (from which we source a significant amount of grants data.) Once we’ve collected 1,000 complete grants lists from a subset of the largest funders, our staff reviews the very largest grants to ensure that they’ve been accurately coded to the correct subject, population served, and support strategy. These facets are captured in Candid’s Philanthropy Classification System.ii Finally, we “freeze” the Foundation 1000 annual sets (however, significant changes to our data or taxonomy periodically require us to update these static data sets.)
Using the Foundation 1000 for trends analysis
We hope that researchers throughout the sector find the Foundation 1000 to be a useful starting place to understand and explore sector trends. If you are creating a giving trends analysis using this data, here’s a few final thoughts to keep in mind:
- Review the underlying grants data. If looking at a particular area of grantmaking within the Foundation 1000, a best practice is to do some manual review of the largest grants to ensure that the coding is aligned with researcher expectations. This is an important step given the largest grants will have an outsized impact on trend lines.
- Be aware that it takes time to see trends. Candid’s Foundation 1000 data sets typically “close” only after we have a comprehensive amount of grants data, which is highly contingent on IRS release schedule of Forms 990. Given this dynamic, Foundation 1000 trendlines tend to end a few years prior to the current year. If exploring grants data outside of Foundation 1000 sets, note that data from the last two to three years tends to be incomplete and shouldn’t be used to derive trends.
- Note that the Foundation 1000 is not a matched set. Due to data availability, certain foundations might not be represented in the data set from year to year. Therefore, the set can’t necessarily be used to look at trends in giving for a specific organization.
To learn more about our grant and transactions data set, download our research manual.
We go into more detail about the Foundation 1000—and specifically, how this subset differs from Candid’s overall data on grants and other philanthropic transactions—in our recently released research manual. Visit our website to learn more about Candid’s custom data sets, including the Foundation 1000, which are available for purchase.
Still have questions about the Foundation 1000? Please reach out to our team at [email protected].
i The largest funders are determined by total giving, as reported on a funder’s IRS form 990/PF for a given year.
ii Most grants are initially coded to the PCS via autocoding processes, often based on available information shared through grant descriptions. For more on Candid’s use of machine learning-based autocoding, see this explainer, under ‘How are grants coded?’
About the author

Related posts

Community foundations: Donor-advised fund grants outpaced contributions in 2022
Find out how donor-advised fund grants given compared to DAF contributions among community foundations in 2022–and what research on this trend may mean for philanthropic giving in the future.
April 23, 2024

Co-leadership: A path to more diverse, sustainable nonprofits?
Dig into insights on nonprofit co-leadership to find out whether this commonplace trend of charitable organizations led by two leaders is opening the door to more overall diversity in the sector.
April 17, 2024

Youth community service: Belonging, reciprocity, and agency
Get insights into how young community service is being redefined by Gen Z and how young people are seeking to maximize their social impact—both for themselves and the communities they serve.
April 16, 2024

Connecting the dots: Fighting for equity through a data partnership
Elizabeth Barajas-Román of WFN shares what a demographic data partnership with Candid enables for advancing equity in the sector, including the first-ever, public dashboard to analyze intersectionality in nonprofit executive leadership.
April 11, 2024

The Maui wildfires: A record in disaster philanthropy, an opportunity to ‘get it right’
CEP’s Tanya Gulliver-Garcia explores funding for Maui wildfires—and what learnings the record-setting response to Hawaii’s recent natural hazard hold for future investment in disaster philanthropy.
April 9, 2024

Collecting demographic data: Nonprofits value transparency but need support
Viewpoint Consulting’s Kelly Brown shares new research findings on sharing demographic data via Candid, including the drivers and barriers of collecting this information to advance nonprofit transparency.
March 28, 2024