article thumbnail

Digital Storytelling to Access, Attract and Activate U.S. Donors

Nonprofit Tech for Good

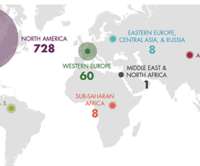
Foundation Maps. Now in its fourth edition, this year’s report provides technology benchmarks for Africa, Asia, Australia and New Zealand, Europe, Latin America and the Caribbean, and the United States and Canada. Donors Can Be Found Online: Foundation Directory Online by Candid. 1) High Net Worth Individuals: DonorSearch. GrantWatch.

article thumbnail

How to Apply Service Design to the Social Sector

Forum One

Social sector service design is fairly well established in Europe and is increasingly growing in the U.S.—especially They conducted extensive research, including an employee workshop, created a current state journey map, and conducted contextual inquiries and phone interviews.

Design 73
professionals

Sign Up for our Newsletter

This site is protected by reCAPTCHA and the Google Privacy Policy and Terms of Service apply.

article thumbnail

HOW TO: Tweet for an International Audience

Nonprofit Tech for Good

Then, over the next 12 hours, on comes nonprofits in India, the Middle East, Africa, and Europe. Additionally, 24timezones.com features a world map with current times plotted and displayed worldwide. It’s amazing what happens on Twitter during our off hours and while we are sleeping – no matter where you tweet from in the world.

article thumbnail

Turning City Data into Apps with Apps4Warsaw

Tech Soup

Led by TechSoup Europe , Apps4Warsaw challenged Warsaw's tech-for-good community members to create useful technology for their neighbors using city open datasets. It all came together when TechSoup Europe began talking to the city of Warsaw about opening up city data to citizens. Image 1 : TechSoup Europe. spanhidden.

Data 36
article thumbnail

The Only Time You Should Use a Pie Chart for Your Nonprofit's Data

Tech Soup

We've covered bar charts, line charts, scatter plots, and maps in Beyond the Pie Chart. Overlay pies on maps. Using pie charts on this map shows the distribution of oil rigs on land versus offshore in Europe. Using pie charts on this map shows the distribution of oil rigs on land versus offshore in Europe.

Chart 61
article thumbnail

Great reads from around the web on August 24th

Amy Sample Ward

Google Doubles Its Cartographers As Maps Continues To Go Wiki-Style - “As an online free mapping service, Google Maps is a great product. And this week, Google has added a couple important areas to the list: Mexico and Eastern Europe.&#. Check out the great examples/case studies!

Mexico 111
article thumbnail

5 Expert Tips for a Successful Salesforce Migration

Saleforce Nonprofit

Assess Your Data & Map it to Your New Model. As you prepare for your migration, one of your first steps should be assessing your data and working to map it to your new model. She previously worked at the World Bank on education policy in Eastern Europe and founded Skill for Kids — a non-profit based in Mongolia.

Tips 122