How do grantmaker CEO salaries compare with other staff?

What’s reasonable compensation for a chief executive officer (CEO)? In the last couple decades, news of golden parachutes and the minting of new billionaires has drawn attention to executive compensation practices. This is especially the case during economic downturns, recessions, and the recent COVID-19 pandemic–when employment plummeted rapidly while some businesses posted record profits.
One of the more helpful ways to explore top executive pay is to examine the ratio of their compensation compared to that of the “median worker” (i.e., the median compensation among all staff at any given organization). Research in the for-profit sector has found that CEOs might make anywhere from six times to six thousand times as much as the median worker.
For example, in The Battle for the Soul of Capitalism, John Bogle estimated a nationwide ratio to be approximately 280:1 in 2004 (up from 42:1 in 1980). More recently, Lawrence Mishel and Jori Kandra from the Economic Policy Institute placed the 2020 figure at 351:1. And last year the AFL-CIO reported CEO-to-median-worker pay ratios ranged from 6:1 to over 6,000:1 for the largest, publicly traded companies (i.e., those on the S&P 500).
How do U.S. grantmakers’ CEO salaries compare?
The Council on Foundations’ annual survey and report on staff salaries and benefits at U.S. grantmaking organizations–to which Candid has contributed for over a decade–provide a straightforward look at staff remuneration. Unlike sources such as the IRS form 990-PF, the survey goes beyond the top-paid employees by collecting salaries for any full-time staff, which match the descriptions in a predefined list of common 35 roles among grantmaking foundations.i
While the survey focuses on salary rather than total compensation (which is a more holistic way to look at the full take-home differences), it provides a helpful metric to use as a baseline. Considering top executives often receive more compensation than most staff through bonuses, deferred compensation, profit sharing, and other supplemental benefits, we can safely expect the total compensation ratios to trend higher.
In 2022, 1,003 grantmakers participated in the survey. While not a representative sample of institutional funders, it’s one of best avenues for detailed exploration and benchmarking of salaries. Based on the 886 grantmakers that reported the salary of a full-time chief executive officer/president/executive director, we see quite a wide range in executive pay: The largest reported CEO salary ($1,106,886) is about 40 times larger than the smallest ($26,866). The median for all reported CEO salaries in 2022 was $200,000.
To explore how these salaries compare with other staff, we first limited the analysis to 646 organizations that reported a salary for their CEO and at least two other full-time staff among the 35 listed roles. These respondents reported the same salary range as the entire set but showed a slightly higher median CEO salary of $220,000.
Analysis set of grantmakers’ full-time CEO salaries
| Min | 25th percentile | Median | Mean | 75th percentile | Max | No. of grantmakers |
| $26,866 | $157,500 | $220,000 | $268,449 | $325,000 | $1,106,886 | 646 |
Next, we divided the CEO salary by the median salary of all other reported full-time staff to calculate individual CEO-to-worker ratios for each organization, and then we compiled the results.
The median ratio was 2.7:1, meaning the CEO was paid 2.7 times as much as the median employee at the same grantmaking organization. The reported ratios are as low as 0.2:1 (where the median employee makes more than the CEO) and climb to 9.5:1 (where the CEO makes almost 10 times as much in salary alone).
Ratio of reported full-time CEO salary compared to median salary of all other reported full-time staff
| Min | 25th percentile | Median | Mean | 75th percentile | Max | No. of grantmakers |
| 0.2 | 2.1 | 2.7 | 3.1 | 3.6 | 9.5 | 646 |
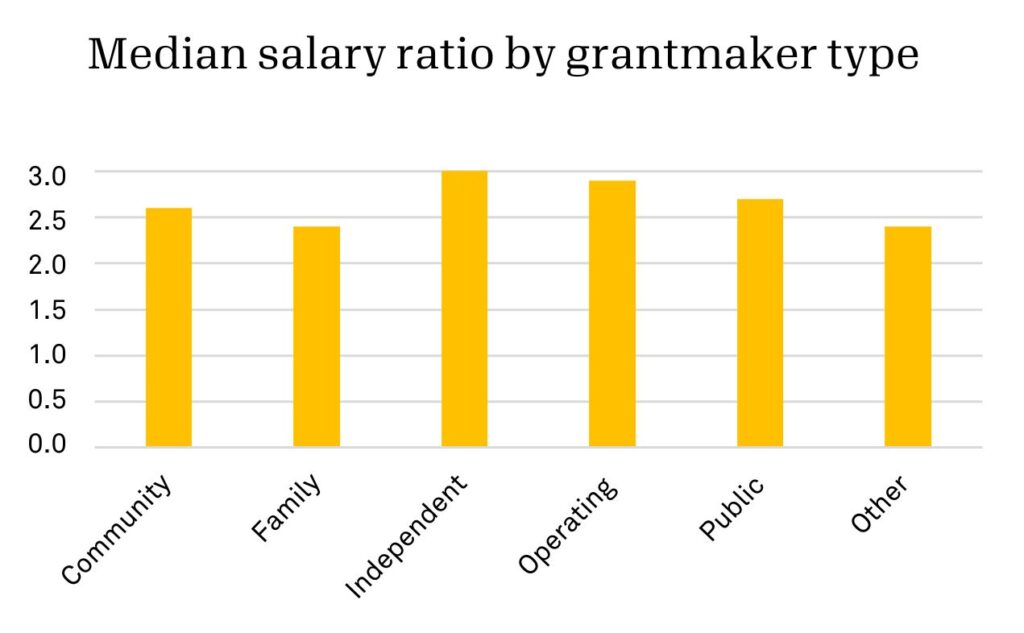
The median CEO salary ratio differs slightly by the type of grantmaker, though not by much. Private independent foundations reported the highest median ratio (3.0:1), and family foundations and “other” grantmakersii reported the lowest median ratio (2.4:1).iii
As the size of the grantmaker rises–as measured by grant dollars awarded or the total number of full- and part-time staff)–so does the ratio.
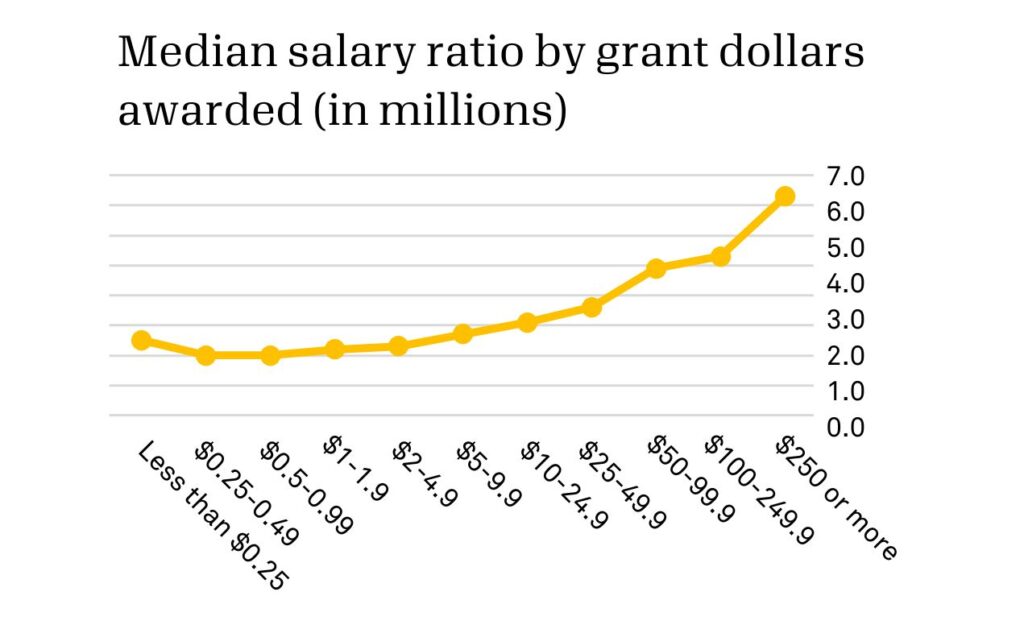
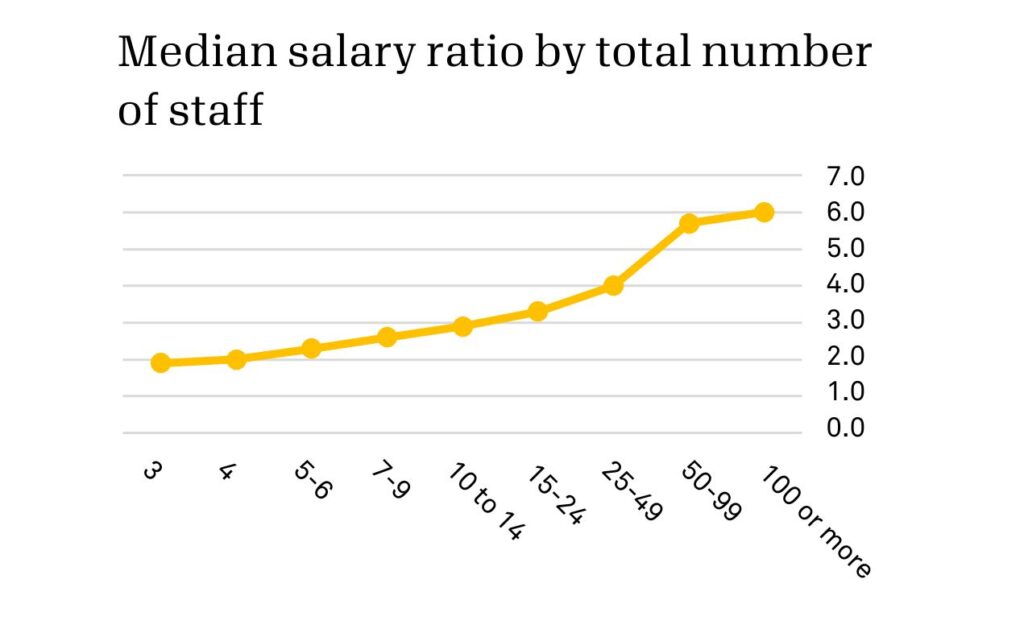
What these figures cannot tell us is the number of grants each organization awarded and how much effort was expended to do so; these factors could further influence the level of decision-making and administrative oversight required to run foundation operations. However, it appears that greater organizational responsibility in terms of dollars out the door and/or the number of employees under management results in greater pay disparity between the chief executive and the median staff member.
When we take CEO tenure into account, something curious shows up. While in general CEOs with a longer tenure enjoy a higher median salary ratio, grantmaking organizations that hired a new CEO in 2021–2022 report a higher median ratio than those with CEOs who have been in place for longer.
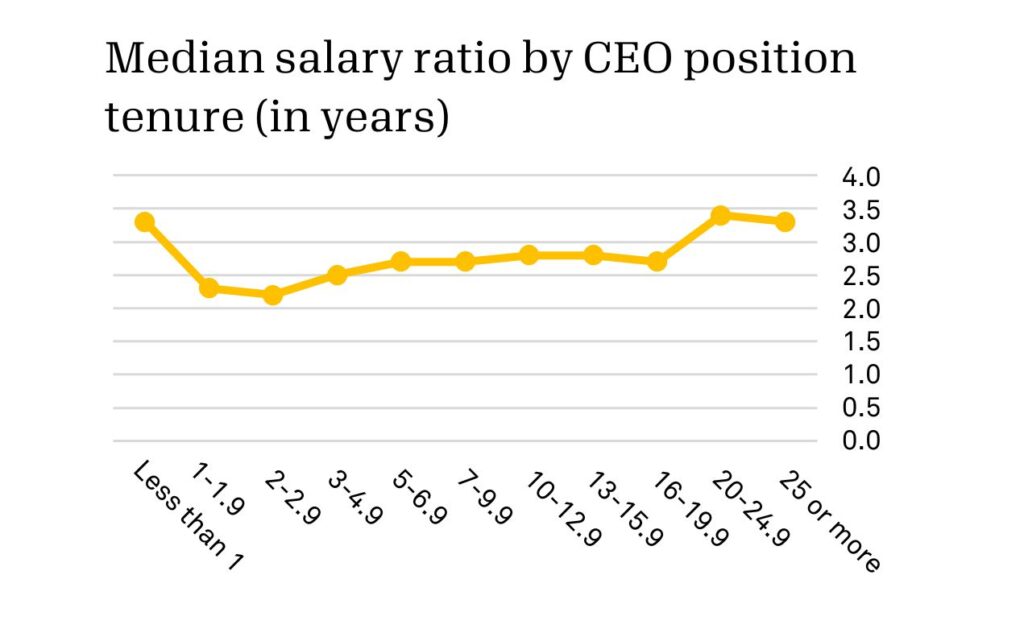
While these new CEOs represent a relatively small sample (15), their organizations vary in size, both in terms of dollars granted and total staff. In the future, it will be interesting to see if this dynamic is related to upward shifts in CEO salaries or other factors.
When compared to their counterparts outside of philanthropy, CEO salaries at grantmaking organizations appear to be much closer to parity with their average staff member. But the question remains: What do these figures mean within a sector that is built on advancing mission and not necessarily financial enrichment?
We hope this blog will spark a meaningful conversation about appropriate pay differences for executives and staff among nonprofits and other philanthropic organizations, and we look forward to monitoring and reporting on any changes to these findings in the future.
i The following list of 35 staff positions have been identified as commonly found among grantmakers: https://cof.org/sites/default/files/documents/files/GSB-Descriptions-of-Positions.pdf. Participating organizations may have staff who fall outside of the 35 roles and are excluded from the survey. These excluded staff salaries may affect the ratios reported above, but without supplemental information, we cannot suggest directionality.
ii “Other” grantmakers include programs or organizations that do not fall under any of the above categories, such as federated and other institutional giving programs. For example, social venture philanthropy, collective giving, United Way organizations, and federations all fall outside of the listed categories and would be considered “other.”
iii Corporate grantmakers (including freestanding foundations, direct corporate giving programs, and combinations thereof) are excluded from this chart because there were too few responses from that group (4), which may lead to spurious conclusions. However, their responses are included in all other analyses.
About the author

Related posts

Scaling positive systems change: Addressing underlying conditions and sustainability
Learn why positive systems change for scaling nonprofits’ impact requires holistically addressing underlying issues of power dynamics, public policies, control over resources, and incentive structures.
April 18, 2024

Connecting the dots: Fighting for equity through a data partnership
Elizabeth Barajas-Román of WFN shares what a demographic data partnership with Candid enables for advancing equity in the sector, including the first-ever, public dashboard to analyze intersectionality in nonprofit executive leadership.
April 11, 2024

The Maui wildfires: A record in disaster philanthropy, an opportunity to ‘get it right’
CEP’s Tanya Gulliver-Garcia explores funding for Maui wildfires—and what learnings the record-setting response to Hawaii’s recent natural hazard hold for future investment in disaster philanthropy.
April 9, 2024

Candid’s DEI commitment, today, and for the future
Learn about Candid’s DEI journey, including how we got started and what we’ll do next to further strengthen our nonprofit’s culture of inclusion and belonging.
April 8, 2024

Doubling down on data for racial equity
Find out how demographic data collection via Candid profiles helps inform equitable grantmaking and reduce the reporting burden on nonprofits in this webinar recap.
April 4, 2024

Mitigating future risks: Why your organization should have an AI policy
Find out three reasons why having an AI policy can help maximize the benefits of new technology while minimizing the risks for organizations seeking to make a social impact.
April 1, 2024
KirkSutton says:
CEO wages at grantmaking organisations appear to be significantly closer to parity with their average staff member than their counterparts outside of philanthropy. But the issue still stands: What do these numbers represent in a sector where mission advancement and not just financial gain are priorities?