Share this article

Every nonprofit has unique needs, which means the data you need readily available isn’t what another organization might need. That’s why we updated Qgiv’s dashboards to be customizable, with drag-and-drop insights to help you build a dashboard packed with data that tells a story about your campaigns, events, and donors! They’re every data-driven nonprofit’s dream.
Beta dashboards are now available for all Qgiv clients today! You can easily opt in when you log into your Qgiv account with the “update my dashboard” button at the top of your current dashboard.
What does this mean for you?
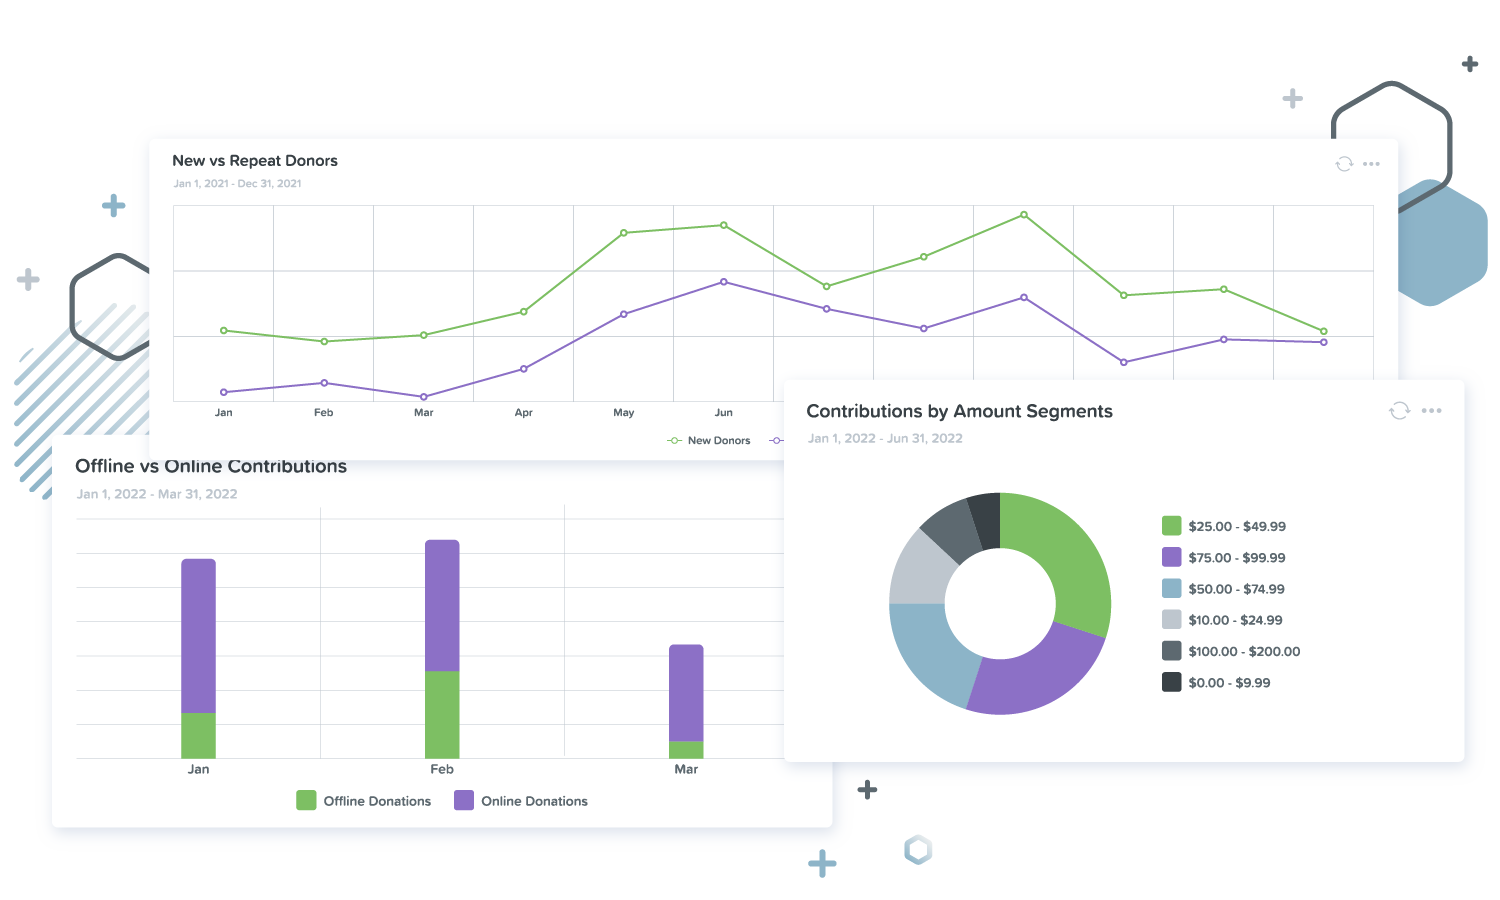
Customizable dashboards offer more insights than previous versions, so fundraisers can personalize their dashboards and quickly have access to the data they need. In addition to new preconfigured dashboards, you can now create a custom dashboard by dragging and dropping individual data insights.
With custom dashboards, you can choose which data to add to your dashboard, organize your data in a layout that appeals to you and your board members, and customize chart types to display data in a way that makes sense for your organization. We’ve also enhanced accessibility by offering a range of color themes, including high contrast and color-blind friendly options. The updated dashboards meet Web Content Accessibility Guidelines AA requirements.
What do you need to do?
When you log into your Qgiv account, you’ll see a banner at the top of the dashboard page. You can easily opt in to the beta by clicking the “update my dashboard” button, or you can refer to our help desk article as a guide.
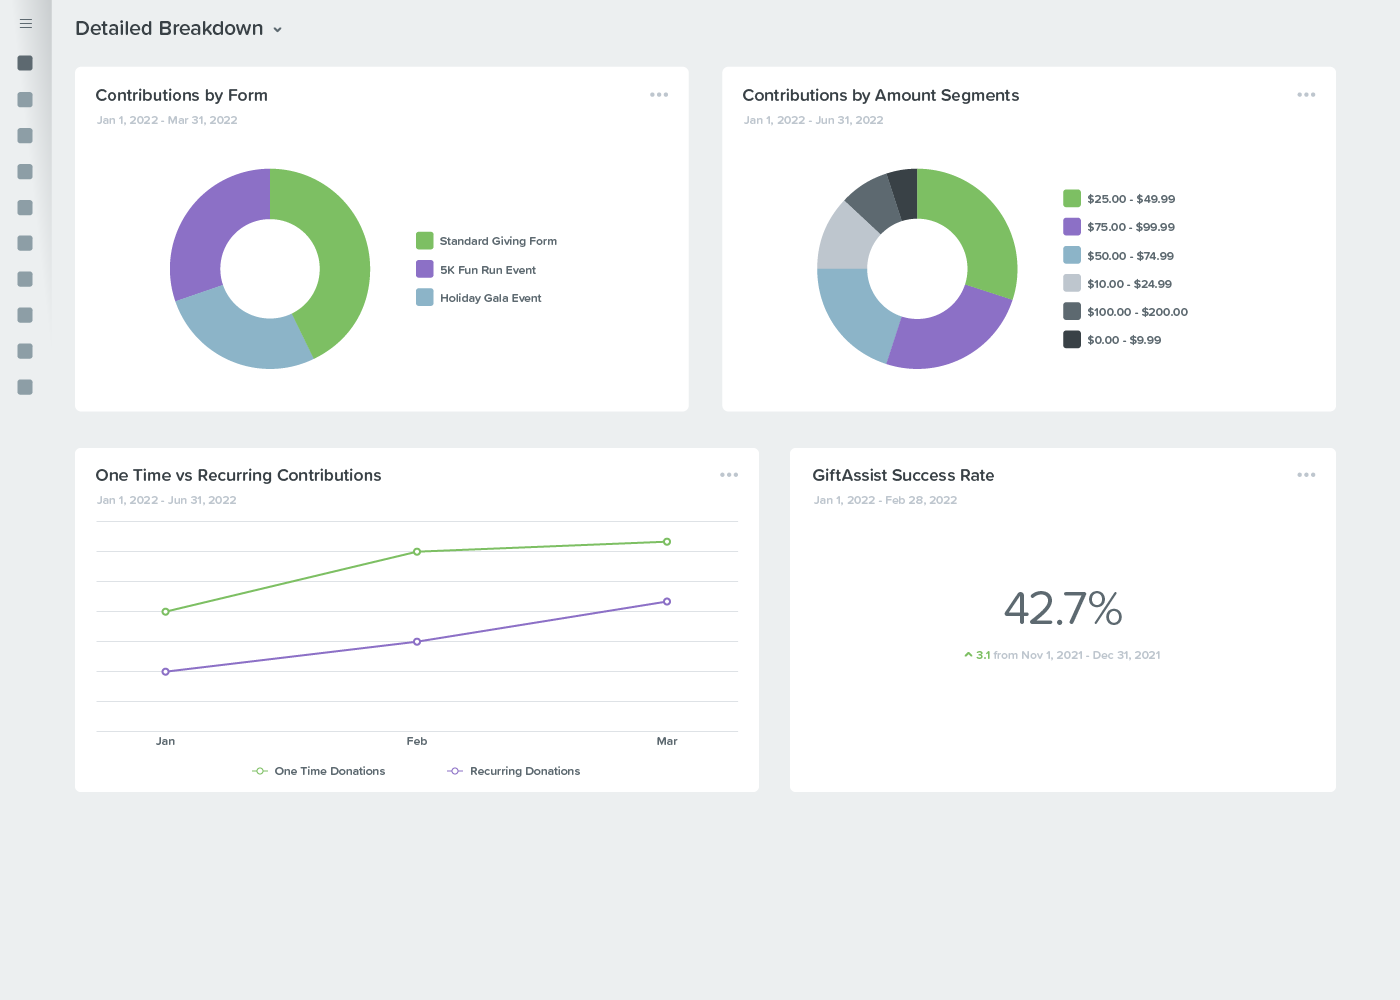
All Qgiv users have access to the Online Processing Overview and Detailed Breakdown preconfigured dashboards, which include insights into overall fundraising success and a detailed view of how and where donors give. Starter package users can create up to three dashboards and have access to basic filtering options and basic data insights.
To get the most out of dashboards, we recommend the Giving Essentials package. With Giving Essentials, you get:
- additional preconfigured dashboards
- the ability to create unlimited dashboards
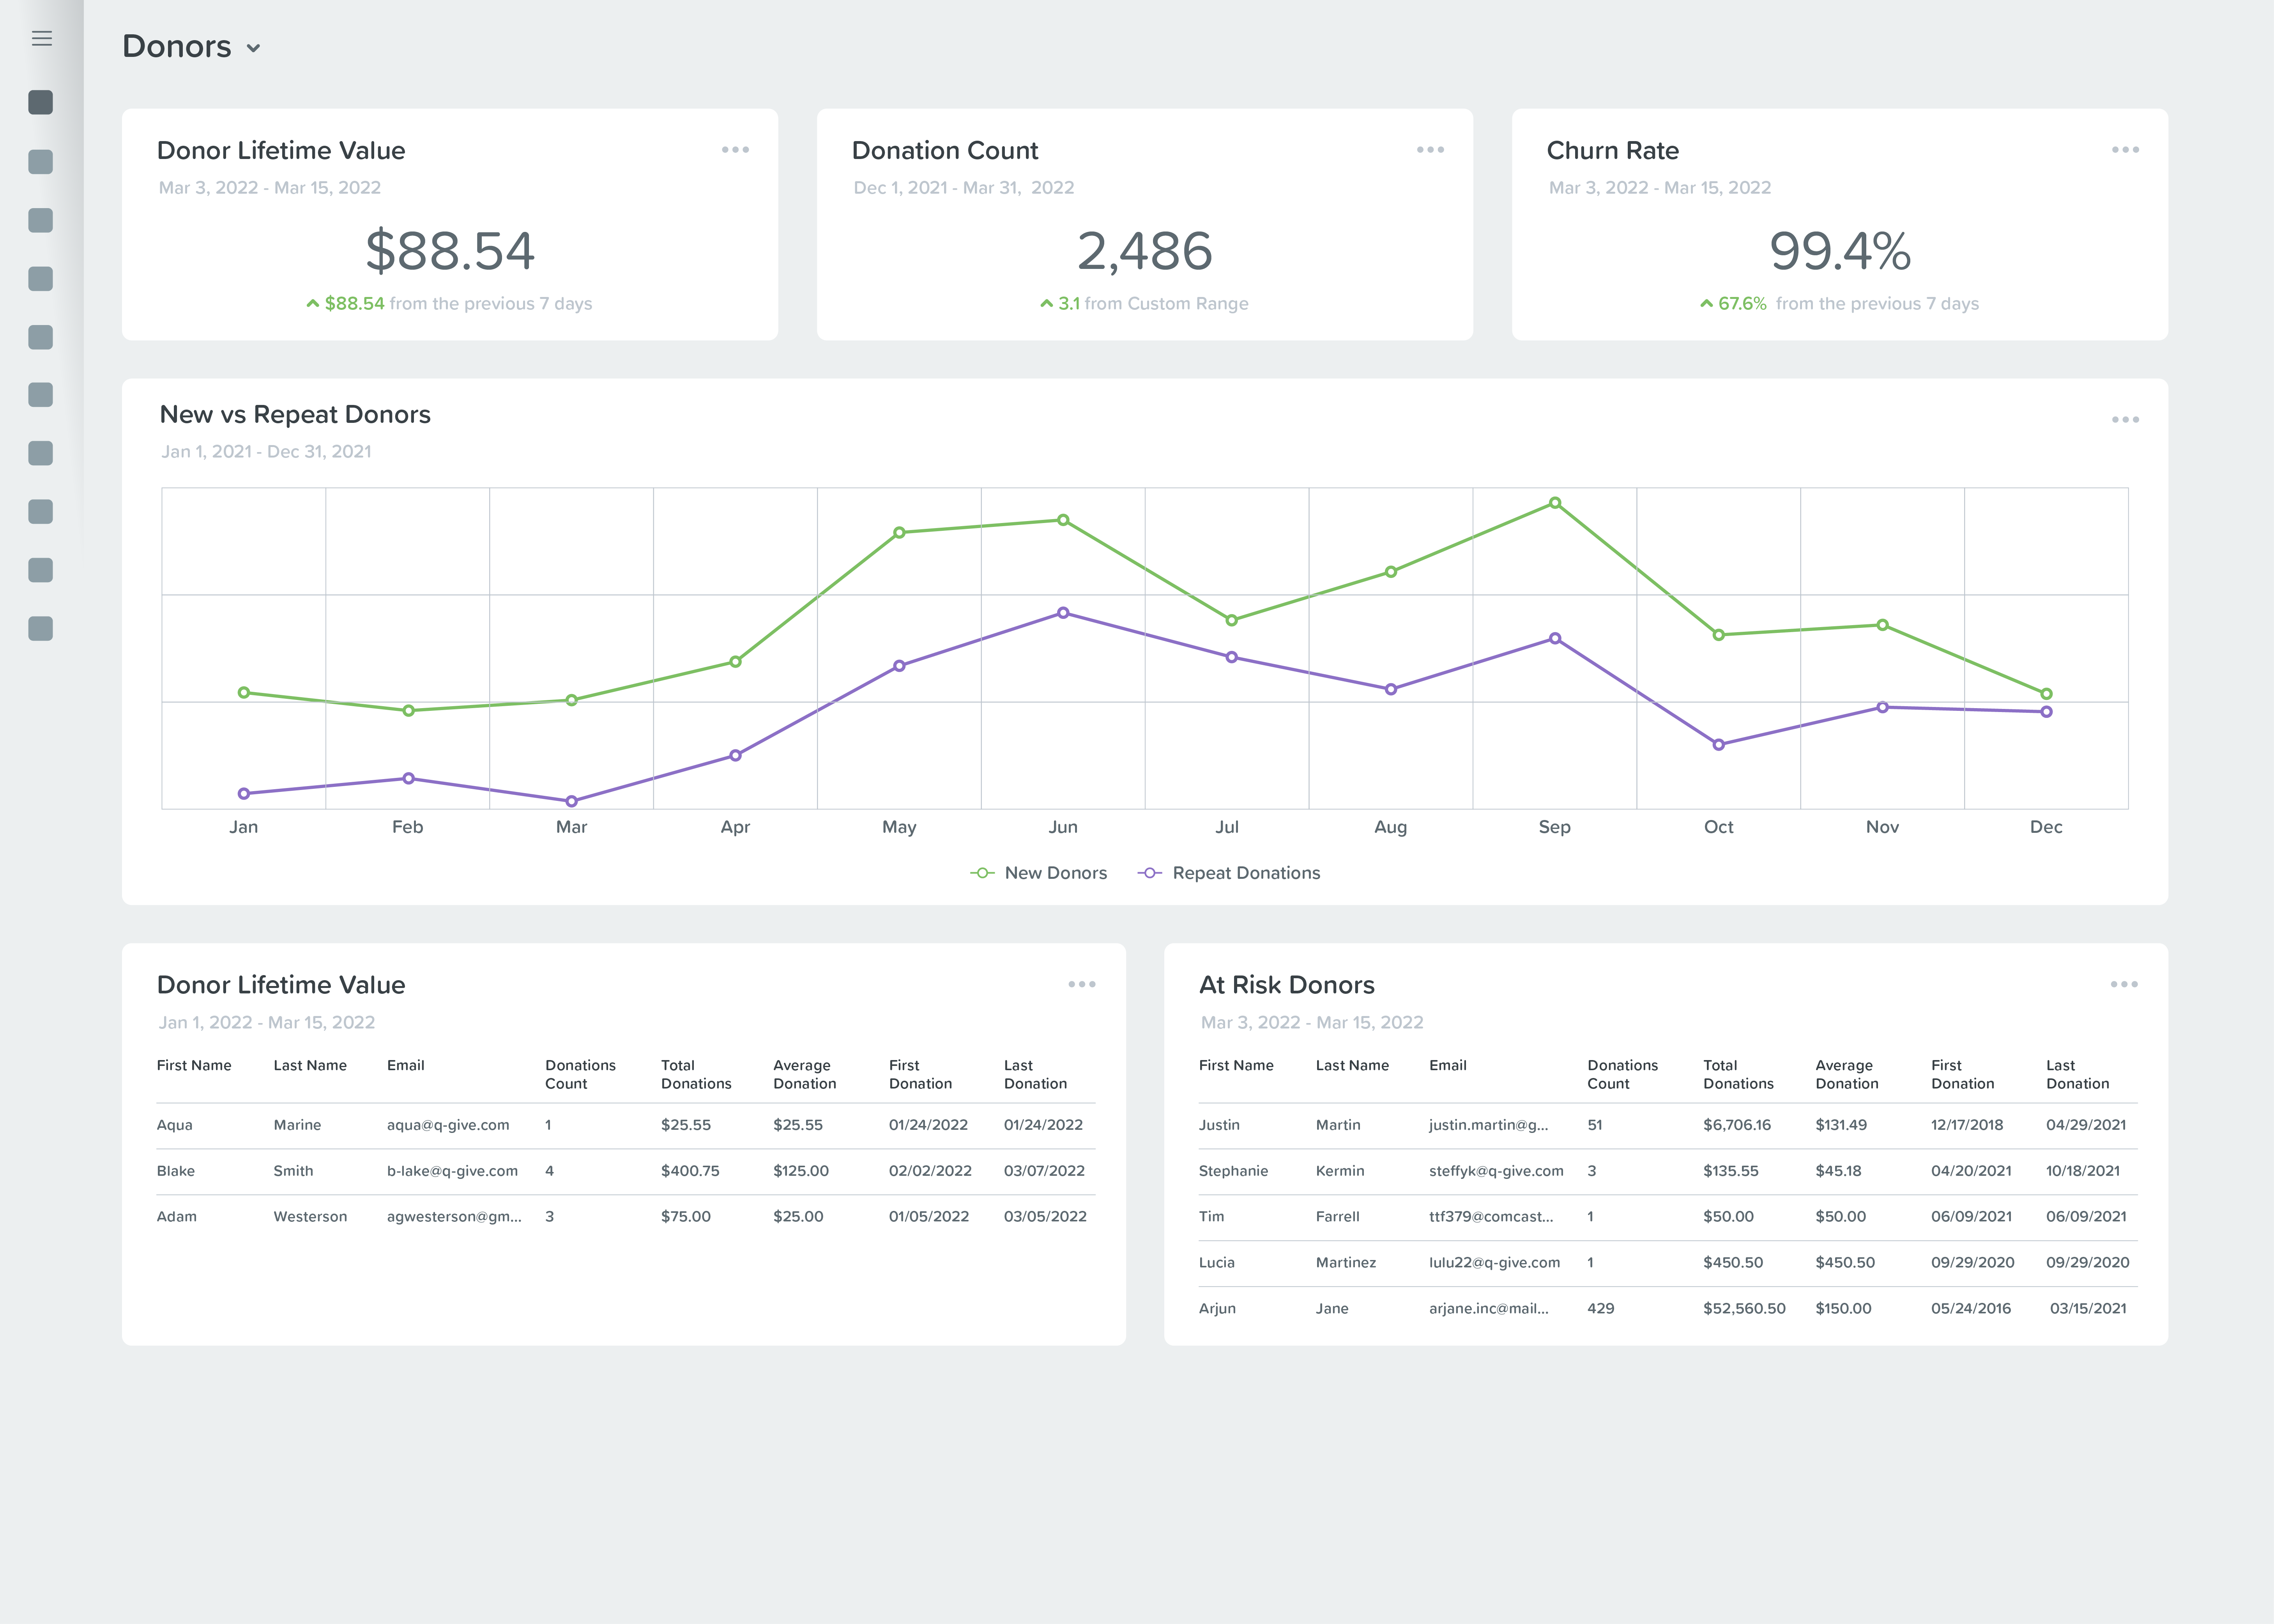
- advanced data insights, including donor lifetime value, retention rate, and at-risk donors
- the ability to compare forms within insights
- access to new features we’re rolling out later this year
We hope you enjoy digging into your data with more flexible options, detail, and customization . If you have any questions about the dashboards or how to access certain features, please contact us. We’re happy to help you be a more data-driven fundraiser!
You might enjoy

How to Start a Nonprofit in 10 Steps
Features
Digital Fundraising Guide: Ideas & Steps to Reach Your Goals
Donor Acquisition and Retention