Making meaning of Candid’s free demographic data set

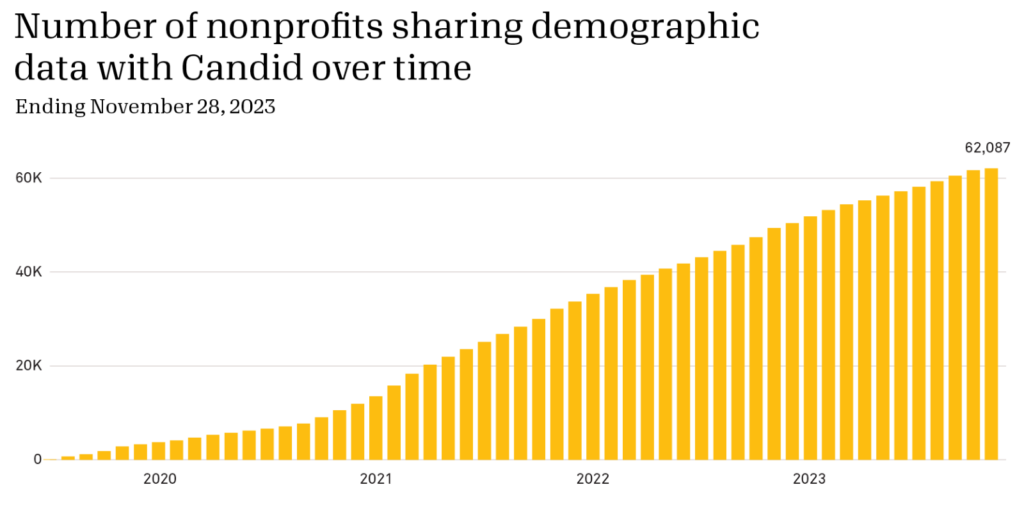
Today, Candid released our latest research manual, Analyzing Candid’s demographic data. Over 62,000 U.S. nonprofits currently share some demographic data about their staff and board with Candid. As a result of our Demographics via Candid efforts, this number has increased significantly over the past two years. In fact, about 1,000 nonprofits are now adding demographic data to their Candid profiles every month.
The data set is a goldmine for researchers and evaluators interested in better understanding the demographics of the nonprofit sector. And perhaps even more exciting, it’s also free to access. But while having this data is an important first step, it’s not the last one. Data is only useful if people understand how to look at and interpret it. As a member of Candid’s insights team, I know this is easier said than done. Over the last few years, many researchers have come to us trying to better understand what data we have, what the data says, and how they can use it.
We created the demographic research manual to meet this need, providing background and best practices for those looking to understand and use this data set in their own research and analyses.
The manual is divided into four parts:
Part 1: Demographic collection and categories describes the types of demographic data Candid collects from nonprofits about race/ethnicity, gender identity, sexual orientation, and disability status, across different staffing levels. This section also outlines how the data is collected and stored. For example, U.S. nonprofits voluntarily share demographic data through their profile. The resulting data set can be considered a convenience sample, capturing the latest demographic data that’s been shared by each participating organization. This first section of the manual also includes a timeline detailing the history of Candid’s demographic data collection since 2014, as well as the various changes that we’ve implemented since then.
Part 2: Demographic data files and formats outlines multiple, free ways to access the demographic data that an organization has shared with Candid, including: 1) By looking at an organization’s nonprofit profile on Candid’s GuideStar; 2) By visiting a publicly available Tableau dashboard, which provides users with aggregate demographics across organizations sharing data; 3) By requesting a spreadsheet of the data set, which details the latest demographic information provided by each participating organization; and 4) by using Candid’s Demographics API. The manual’s second section details out the similarities and differences across these formats. It also offers suggestions on when researchers and evaluators may want to choose one method to access the data over the other.
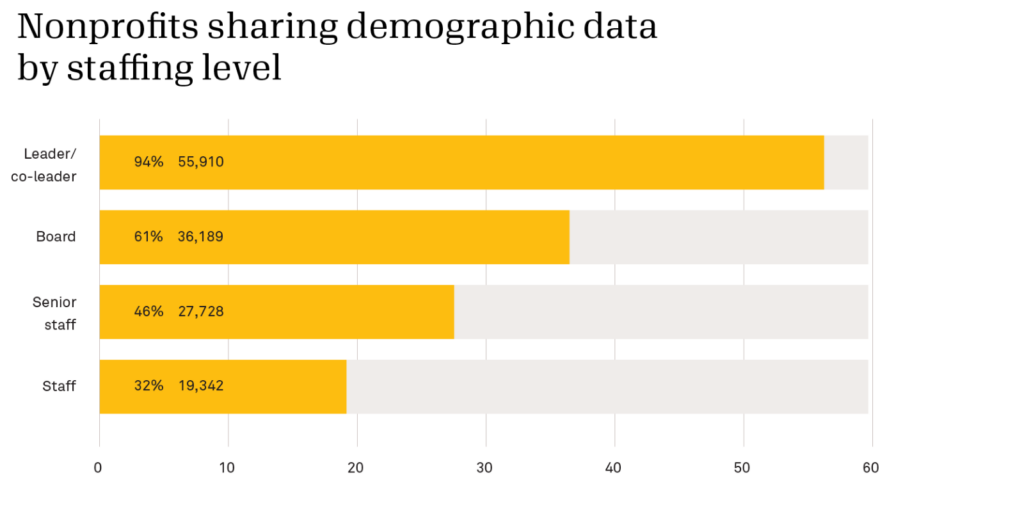
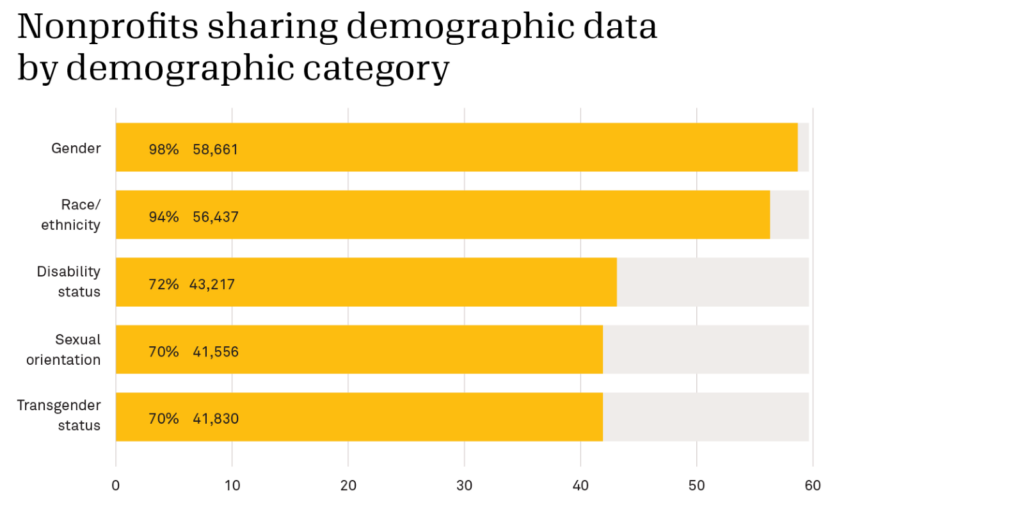
Part 3: Understanding the demographic data set shares some features of the data that will affect how researchers interpret it. This section of the manual also highlights the data set’s dynamic, cross-sectional nature. It describes the degree to which U.S. nonprofits across the sector are sharing demographic data with Candid and offers detailed analyses that Candid’s insights team created to evaluate representativeness in the data set. Additionally, the manual’s third section describes response attrition in the data set, details changes to the race/ethnicity categories in the survey, and explains some key limitations of the data. For example, the charts below (also included in the manual) illustrate how complete the data is across different staffing levels and demographic questions.
Part 4: Working with Candid’s demographic data offers tips to researchers looking to conduct their own analyses using the data set. Topics include opportunities (and challenges) around longitudinal analysis and joining the demographic data with other commonly used data sets. The section describes cleaning processes that can be used to remove unusable responses and recode write-in responses. Finally, the manual wraps up with a discussion about defining and operationalizing ‘BIPOC’ (Black, Indigenous, and people of color) and ‘BIPOC-led’ within the demographic data set.
If you find yourself with a question for a study that draws on demographic data from Candid, check out the new research manual—or its abridged FAQ. If you also have any questions about grants data, look to our first research manual in the series, Analyzing grants and other philanthropic transactions.
Still have questions about incorporating Candid’s demographic data set in your research? Please reach out to us at [email protected].
About the author

Related posts

Co-leadership: A path to more diverse, sustainable nonprofits?
Dig into insights on nonprofit co-leadership to find out whether this commonplace trend of charitable organizations led by two leaders is opening the door to more overall diversity in the sector.
April 17, 2024

Youth community service: Belonging, reciprocity, and agency
Get insights into how young community service is being redefined by Gen Z and how young people are seeking to maximize their social impact—both for themselves and the communities they serve.
April 16, 2024

Connecting the dots: Fighting for equity through a data partnership
Elizabeth Barajas-Román of WFN shares what a demographic data partnership with Candid enables for advancing equity in the sector, including the first-ever, public dashboard to analyze intersectionality in nonprofit executive leadership.
April 11, 2024

The Maui wildfires: A record in disaster philanthropy, an opportunity to ‘get it right’
CEP’s Tanya Gulliver-Garcia explores funding for Maui wildfires—and what learnings the record-setting response to Hawaii’s recent natural hazard hold for future investment in disaster philanthropy.
April 9, 2024

Collecting demographic data: Nonprofits value transparency but need support
Viewpoint Consulting’s Kelly Brown shares new research findings on sharing demographic data via Candid, including the drivers and barriers of collecting this information to advance nonprofit transparency.
March 28, 2024
What’s trending? Top subject searches in Candid nonprofit profiles
Candid nonprofit profiles help funders, donors, DAF advisors, and others find organizations to support; read this article to learn what supporters searched for most in February 2024.
March 27, 2024
Kate, Digital Communications Manager, Candid says:
It depends on what information the nonprofits want to collect and share. Nonprofits can collect this information about their board and we provide space for them to share that information in their nonprofit profiles.
jane scaccetti says:
do you ask about the demographic profile of the board as to gender and ethnicity?
Kate, Digital Communications Manager, Candid says:
There are a few ways you can see compensation:
1. GuideStar Pro
2. Nonprofit Compensation Report
3. Free 990s search
You can also reach out to [email protected] with any additional questions.
Patricia Duarte says:
I used to be able to access information on salary for highest paid employee in an organization. Is that no longer available to the public for free?