article thumbnail

How are you using metrics, benchmarks, and experiments to improve your Facebook presence?

Beth's Blog: How Nonprofits Can Use Social Media

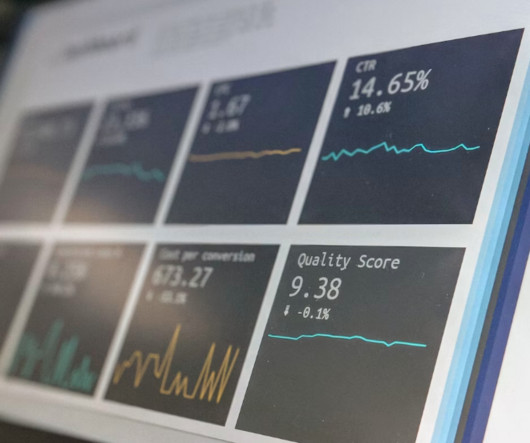
To refine a content strategy, I used the Fan Page insights metrics tool, particularly the stats on interactions and Fan Page growth. Here are some metrics that I use to harvest insights on those questions. Media Consumption: Total photo views, audio plays, and video plays for the content you have uploaded to your Page.

Metrics 97
article thumbnail

End-of-Year Fundraising Findings Feast

M+R

This analysis took a look at digital revenue from email subscribers at end of year that was not sourced to email. Other platforms that some organizations added to the mix this year included Connected TV, incentive advertising, audio advertising, and native advertising. . BORING DETAILS EXCITING METHODOLOGY DETAILS.

professionals

Sign Up for our Newsletter

This site is protected by reCAPTCHA and the Google Privacy Policy and Terms of Service apply.

article thumbnail

Artificial Intelligence for Nonprofits: Your List of AI Tools to Use for Good

CauseVox

Enhanced Data Analysis AI can also analyze data more quickly and effectively. Your organization probably generates and collects a lot of data, and AI-powered data analytics tools can help you gain insights into donor behavior, program outcomes, and other key metrics.

Tools 58
article thumbnail

NpTech Tag: Change.org To Launch White-Label Social Network for Nonprofits, GeekToys that Give Geekbumps, and Blog Readability

Beth's Blog: How Nonprofits Can Use Social Media

As FrogLoop blog concludes in its recent analysis of MySpace, "Social networking sites are essentially a microcosm of the internet, and hosting a profile on either is akin to managing a website. Quick audio or video messages published to a trusted social community. What do you think?

article thumbnail

2022 Wrapped: Year-End Fundraising Edition

M+R

For our overall analysis, we included only one-time gifts — ongoing monthly revenue is not included in those numbers, and all gifts are in the months of November and December in order to include Giving Tuesday. The averages we report for each metric are medians — they represent the middle nonprofit out of all those that provided data.

article thumbnail

Unlocking Success: Nonprofit Board Presentation Tips

Qgiv

Explain your analysis of the figures and how they affect your mission to keep your members emotionally connected. Utilize your reporting tools When deciding what data to present, use different metrics to support your end goal. Some of your board may call via audio or video call instead of sitting in the room.

Slides 52
article thumbnail

End-of-Year Giving: 21 Best Practices for a Great Campaign

Qgiv

Conduct post-campaign analysis. Get Qgiv’s Campaign Analysis Worksheet! Measurable: Choose metrics that will help you know whether you’ve met your goal or not. Here are the elements of a great video: Clear and steady camerawork Good lighting Music that fits the message Clear and succinct audio.