ARTICLE
How Florence Nightingale Helped Modernize Storytelling Using Graphs

We learned recently that a good dashboard can display data in a way that doesn’t exclude 93% of your board and management.
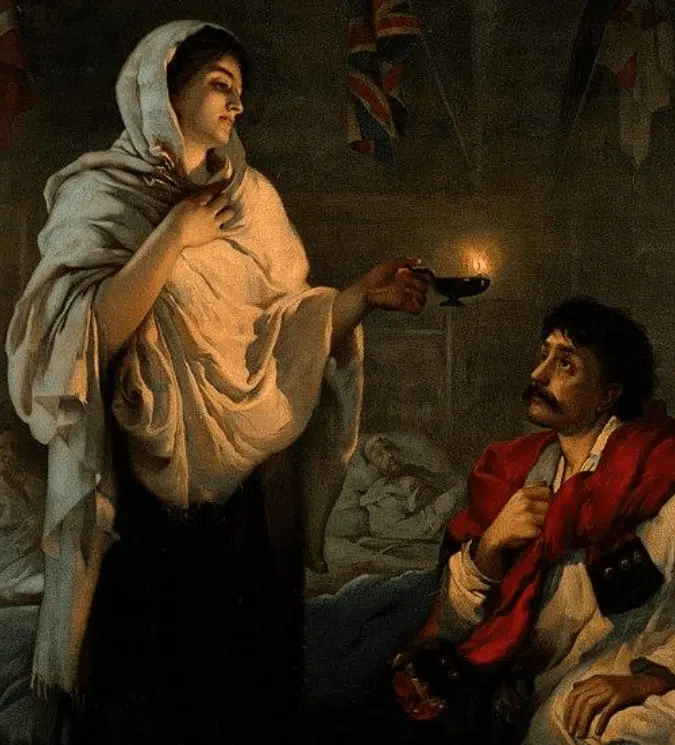
But did you know that Florence Nightingale did more than just light a lamp to check on hospital patients at night? She did more than inspire modern nursing and modern hygiene. She also helped modernize storytelling for the public good by using graphs!
That’s right: The graphics that contribute to good nonprofit storytelling have roots that include Nightingale’s hand washing and hygiene campaigns.
Florence Nightingale deserves recognition—and not just as a healthcare pioneer. She pursued a passion for math and good recordkeeping in a time when society generally discouraged women from any role but homemaker.
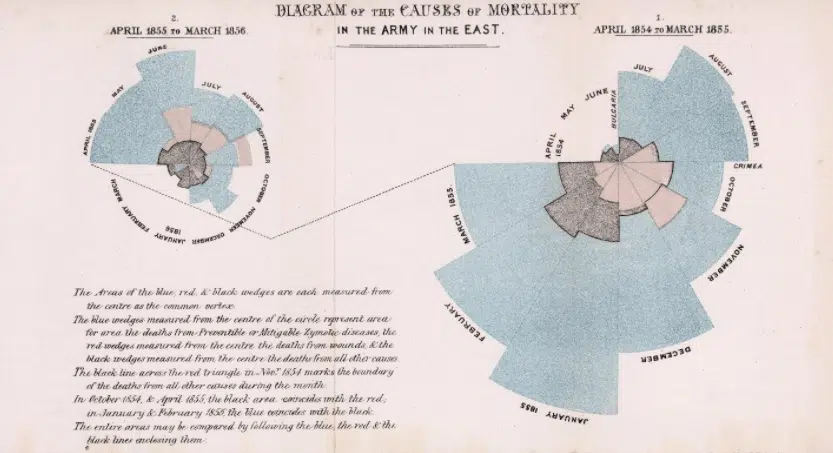
While caring for the wounded during the Crimean War, she kept good mortality records in part to measure the effectiveness of basic sanitation measures that she introduced. Back then, most people didn’t understand how sick you could get from things like not washing your hands or even dumping animal carcasses in a well. Her data, cleverly turned into graphs, helped change their minds and ultimately saved millions of lives.
Nightingale understood something that would take science 150 more years to measure with precision: Transforming data from tables into graphs (aka infographics) can create a powerful impression on their viewers in less than a second!
In other words, if you want to engage someone and recruit them to your cause, you can’t beat a good graph.
In the 1800s, Florence Nightingale effectively used data visualization (aka graphs) to make a significant impact in public health. Today, nonprofits still have much work ahead of them to create the world we dream of.
The good news is that modern technology has made it cheaper and easier than it was even 20 years ago to turn numbers into great graphics.
Ask yourself the following questions:
If you have, well done. If you haven’t, the time has come. The “Lady with the Lamp” has shown us the way and 21st century technology makes it easy and affordable, even for small nonprofits.


Comments