


SplineTech Javascript debugger
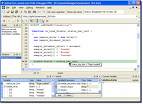 If you've been working with Javascript in your web applications, you've no doubt spent some time wishing you had a real programmer's tool to work with - some way of setting breakpoints, inspecting variables, and the like. Instead, most javascript development proceeds by sticking in alerts and document.writes all through the code to see what's going on. If you've been working with Javascript in your web applications, you've no doubt spent some time wishing you had a real programmer's tool to work with - some way of setting breakpoints, inspecting variables, and the like. Instead, most javascript development proceeds by sticking in alerts and document.writes all through the code to see what's going on.Maybe this can change. I've just downloaded the SplineTech Javascript Debugger Pro, and while I haven't really settled into using it yet, it seems like it might be the missing link in Javascript development. Launch your web page in it, and it opens IE to display your application, while tracing the code in a multipane debugger window. There's a watchlist where you can set up global variables to watch; but there's no need to do this with local variables, which appear and disappear in the local pane as they are defined or go out of scope. The variables in this pane are tree-structured: you can go to a variable holding the return of an XMLrequest and inspect the entire DOM. I was particularly pleased with the inclusion of a current variable pane, which provides a scrolling window to display a single variable; I found this very useful when trying to inspect long strings holding HTML or XML source. The debugger also allows you to hover over any variable in the code to inspect its value. Installation was simple and straightforward. But after I installed, I was unable to get the app to stop at breakpoints to allow me to debug. I wrote Splinetech support, and got a prompt reply asking for my Windows and IE versions. Within twenty-four hours I was issued a new Splinetech executable where the problem was solved. One limitation of the program is that it works only with HTML web pages. Pages that were produced by server scripts - such as php or ASP pages, must be captured by viewing the page source and saved as HTML before debugging. This works fine, but it adds a step to the debug-edit-run cycle. Your instinct is to edit the page in the debugger directly. But instead, you need to edit the asp file, launch it, and recapture it as HTML. I got into a cycle of working and editing in the static page for a while, then copying the changes over to the ASP page. It would be very nice to have all of this automated some way. But overall, here is a Javascript debugging tool that really seems to work like the development environments we're used to. You might really want to take a look at it if you're doing any Javascript work. Technorati Tags: nptech, programming, javascript |
posted by Michael Stein at Tuesday, July 18, 2006
![]()
![]()
Comments on "SplineTech Javascript debugger"
post a comment