My latest contribution to the Stanford Social Innovation Review is now published. You can read the post and join the conversation on the SSIR Opinion blog, or read the full post below.
—–
Inevitably, January is filled with predictions and resolutions. We ponder the innovations and evolutions that may unfold in the technologies we use, and consider the issues we want to tackle in our work and communities.
Me? I’m focused on data. This year will, I hope, be the year of data. I see more organizations looking for ways to be data-driven in decision making, communications, campaigning, and marketing, and I see a growing interest in and understanding of the value in sharing data. The more we share our data with each other inside and outside of our organizations, the more data-driven we can be in our work collectively.
If you’ve been waiting for an invitation to dive into data, this is it. You are cordially invited to start tracking, measuring, evaluating, and sharing! Here are a few ways to get started:
Data for Promotion
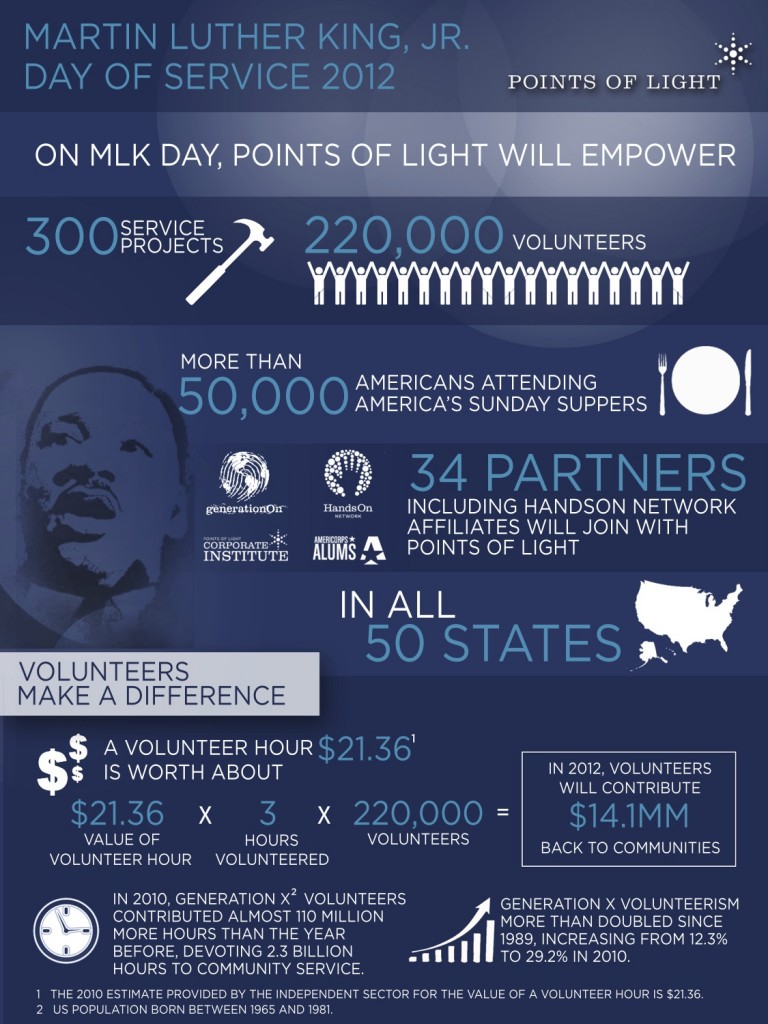
Many organizations use selected statistics, data, or other information in press releases and calls to action, but we may not look at those numbers or statistics as stories that compel us to share, respond, and take action. There are ways, however, to use data to tell a more active story. Here’s an infographic that Points of Light shared during the ramp up to its 2012 Martin Luther King, Jr. Day service events. Looking at the cumulative impact of volunteers is really powerful when it’s presented in this way:
Data for Engagement
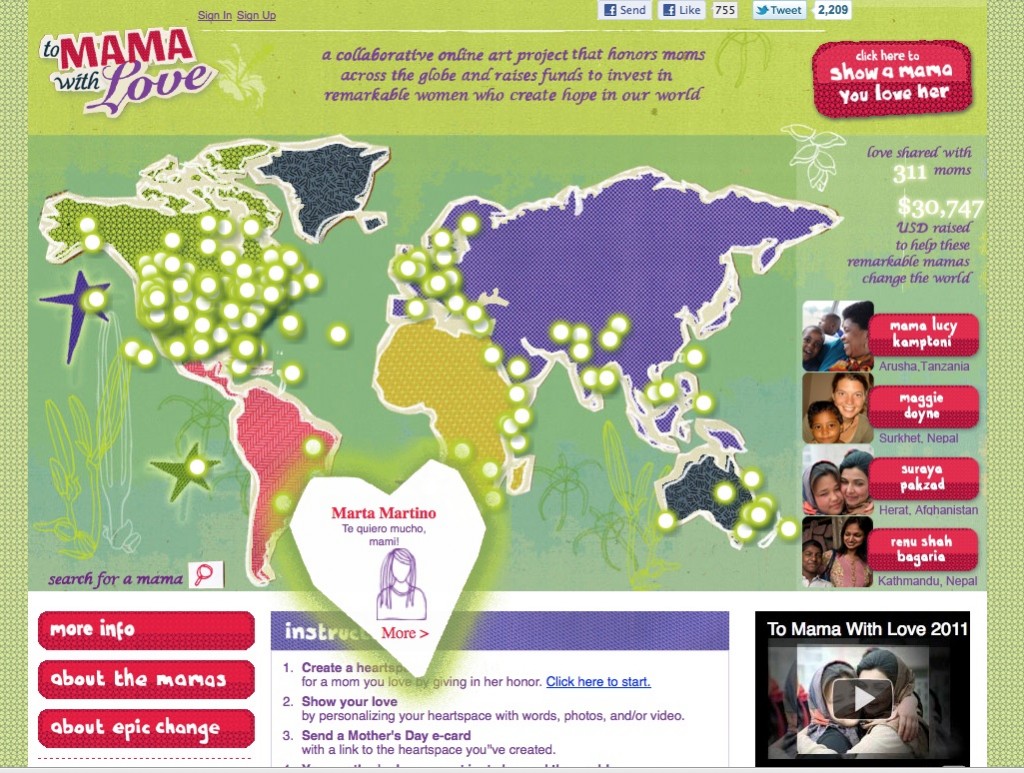
Using real-time tools to engage people through data can help increase both the time people spend on your site and the amount of information you can convey quickly. Mapping is one of the most-used and easily recognizable options. It’s easy to see and understand a map right away (especially using something like Google Maps, which most people have seen before or even used themselves). One great example is the wayEpic Change uses a map as the main interface for its To Mama With Love campaign.
The To Mama With Love site encourages visitors, without any written instructions, to click locations on the map, read through the user-created word, photo, and video dedications to moms (or, “heartspaces”), and engage with others’ stories by sharing or donating.
Data for Reporting
Organizations are also sharing data in many ways. Some if it is visual, such as in this terrific infographic that illustrates trends for where we are giving our time and money:
This year, I would love to see nonprofit organizations, service agencies, and local groups working together to share their data in the effort to more accurately map our collective impact and to identify new opportunities for partnership and collaboration. Imagine if you could see a map of hunger in your city that included a broader set of data than what Share Our Strength, Feeding America, or your local food bank has collected. What if the map included information from service providers, schools, and other local organizations? You would get a clearer picture of the issues causing hunger in your community—and be that much clearer about how to tackle the problem. Maps can reveal things such duplicated efforts and can help us understand where to invest. I would love to see that map! And I would love to help.
What are you looking to do this year with your data? What are you working on now? I would love to see or hear about any examples you already have.


“The COHRED Group would like to announce the official launch of its first photo competition “Capturing Research and Innovation for Health, Equity and Development”!
This photo competition, held in the context of our upcoming Forum 2012, aims to bring to light innovative research projects and to illustrate their impact and value to people’s lives, in real circumstances. Selected photographs, representing research and innovation for health, equity and development, will be showcased at Forum 2012 in Cape Town. These pictures will be used to illustrate ways in which research for health can be brought to the next level through appropriate policies and investments.
We invite you to send in your submissions before the 29th of February and to send the word out to your networks today!
For more information visit our website http://www.forum2012.org/photo-contest