
 Are Google Analytics your best friend? Does data that gives you insight into your fundraising and advocacy strategy make you happy? If not, they should be. Analytics and metrics are what should be informing your content, your strategy, and your nonprofit campaigns.
Recently General Assembly and HubSpot teamed up to generate a report to fill you in on all the important metrics: Introduction to Inbound Marketing Analytics and the Key Metrics Your Executives Want To See.
They cover what your analytics should look like, and what exactly you should be measuring.
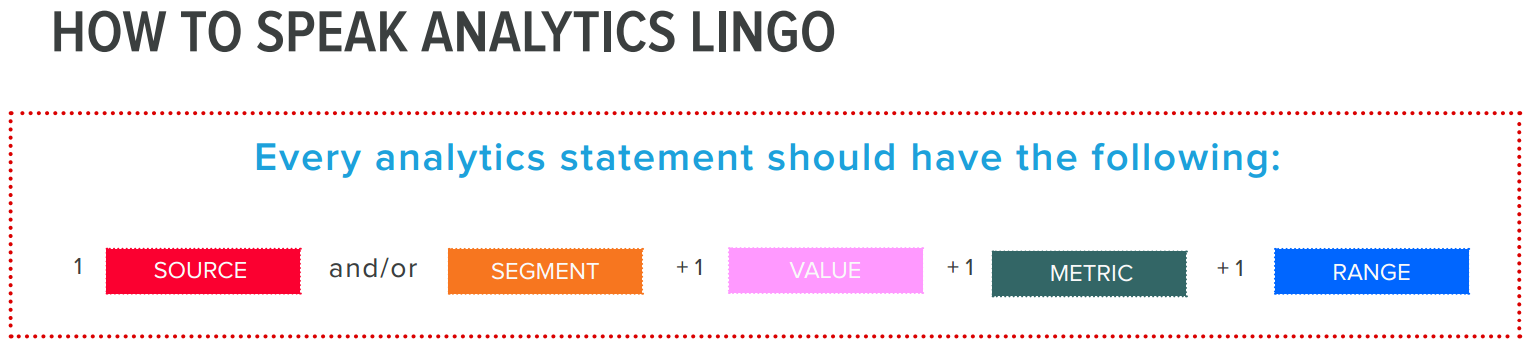
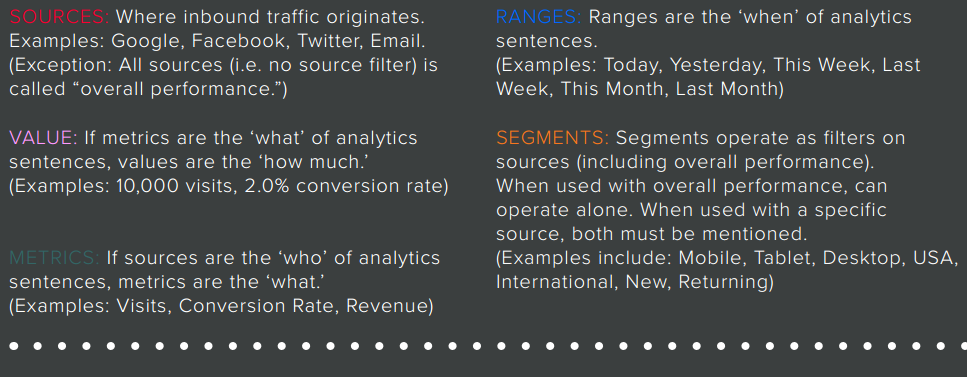
But you also don’t have to be metric-savvy before diving into the report. All the lingo is clearly laid out and defined:
We’ve gone through that report and have pulled some key points that will be useful to your nonprofit reports. It’s critical to note that not all metrics your higher-ups want to see are the most valuable metrics.
-
Have a multi-faceted strategy. Every piece of content you create or campaign you run should be designed to drive traffic to your website and landing pages, giving you the chance to convert visitors into leads such as advocates, donors, and volunteers.
-
Try to acquire new visitors, but also keep engaging the repeat visitors. The more repeat visitors you have to your site, the more “sticky” it is (i.e. prospects are finding valuable content that keeps them coming back for more). If your repeat visitor rate is only in the single digits, your site might not offer enough valuable information to capitalize on the link or campaign that attracted a new visitor in the first place. Conversely, if your repeat visitor rate is higher than 30%, you’re probably not growing your audience enough to generate new business. A healthy rate of repeat visitors is about 15%.
-
Know your sources, and continue to be aware of how that’s shifting on a biweekly or monthly basis. Checking your traffic sources tells you how well your search engine optimization (SE0) efforts are performing. For example, you’ll want to see your share of organic traffic rising until it reaches 40%- 50% of total traffic. Likewise, you can gauge the effectiveness of your link-building efforts by tracking referral traffic. Aim for referrals to deliver 20%-30% of overall traffic.
Is the lingo unclear? Organic traffic comes from a link found on a search engine results page VS. Referral traffic comes from a link on another website. -
Updating your blog is helpful. Indexed Pages are the number of pages on your site that have received at least one visit from organic search. This metric tells you how many of your pages are being indexed by search engines and are getting found by users. Know this, and then you can drill down to see which landing pages receive the highest percentage of visits. 89% of companies that update their blogs multiple times a day reported acquiring new people through their blog. This compares to 72% of companies who only update their blog once a week, so clearly, the more frequently you blog, the more it pays off for your website.
But, what’s the point of having more indexed blog pages? It means more opportunities to get found via organic search, making it more likely that you’ll generate new donor and advocate leads through your content creation -
Monitor Conversion Rates. By monitoring your conversion rates, you’ll know how well you’ve been capitalizing on the traffic coming to your site. You can monitor several different types of conversion rates, including:
- Visitor-to-Lead Conversion Rate: the percentage of visitors who become leads - potential donors, advocates, volunteers, etc.
- Lead-to-Customer Conversion Rate: the percentage of leads who become advocates, donors, volunteers, etc.
- Visitor-to-Customer Conversion Rate: the percentage of visitors who become advocates, donors, volunteers, etc.
Tracking each of these conversion rates is like giving your marketing funnel a checkup. You’ll see where you’re doing well – such as converting visitors into leads – and where your funnel may be leaky, such as failing to convert those leads into customers.
What are the most important metrics for your org to track? How well do you think you’re doing? What could you improve?
Stay tuned for highlights on how to measure your email marketing. Until next time, remember that email isn’t dead, and there’s lots of work to be done to make your content even more impactful.

COMMENTS