Remove 2010 Remove Analysis Remove Trend Remove United States
article thumbnail

The 2014 Charitable Giving Report

Connection Cafe

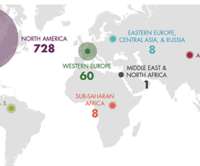
It is the largest analysis of actual overall and online giving data in the nonprofit sector. Overall Giving Trends. In 2014, overall charitable giving in the United States increased 2.1% Online Giving Trends. on a year-over-year basis. compared to the same time period in 2013. Online giving grew 8.9%

Report 20
article thumbnail

Charitable Giving Grew to $373.25 Billion in the U.S. in 2015

Connection Cafe

This is the sixth consecutive year of increases in giving, a period of growth that began in 2010. Giving USA also reports that 70% of all charitable giving in the United States goes to religious organizations, education institutions, human services nonprofits, and gifts to foundations. Macroeconomic Trends. Who is Giving.

Giving 20
professionals

Sign Up for our Newsletter

This site is protected by reCAPTCHA and the Google Privacy Policy and Terms of Service apply.

article thumbnail

Mapping funding for racial justice: A political imperative

Candid

Since 2010, Human Rights Funders Network (HRFN) and Candid have partnered on research that maps funding for human rights globally. Our analysis provides an evidence base to understand and strengthen resourcing for social change. We are changing our analysis and shifting our practices to be fully accountable to racial justice movements.

Map 98
article thumbnail

Why Apple isn't the Nonprofit App Grinch | Nonprofit Trends with.

sgEngage

All Blackbaud Blogs Contact Us Blackbaud.com About Nonprofit Trends Books Research Reports Speaking Why Apple isn’t the Nonprofit App Grinch Posted by Steve MacLaughlin on December 10th, 2010 Nonprofit social media expert Beth Kanter isn’t happy with Apple at the moment. But that’s a blog post for another day.

Trend 75
article thumbnail

New Study of High Net Worth Philanthropy | Nonprofit Trends with.

sgEngage

There are 75 pages of statistics and trend information in the report. About the Study Participants This study reflects the attitudes and behaviors of more than 800 respondents throughout the United States with household income greater than $200,000 and/or net worth (excluding the value of their residence) of at least $1,000,000.

Studies 75
article thumbnail

[VIDEO] Counting the Costs: Where Capital Campaigns Often Miss the Mark

Bloomerang

Or there’s a second bucket that I’m really sort of anecdotally seeing a strong movement or a strong trend in the community. million nonprofits in the United States and you think about the number of new nonprofits over the last 15 years, 200,000 give or take new nonprofits. One from Holly. Doing the silent phase.

article thumbnail

4 Things Your Nonprofit Needs to Know About Online Donors

Connection Cafe

The findings are based on analysis of online and offline giving data from sixteen large national nonprofits in the United States during 2016 and represents more than 6.5 The data analysis reveals that online only donors tend to have higher household incomes than offline only donors. million donors.

Offline 35